

Rebound from the RCI3 single line and the rising trend line and the mBDSR signal
Indicator that shines in combination with RCI: 【BODSOR・mBDSR】
https://www.gogojungle.co.jp/tools/indicators/11836
※An indicator developed to improve entry accuracy when performing breakout purchases on dips or selling on rallies using three RCI lines
A PDF file with 150 items is included.Many of themare examples that break down the process of logically linking higher and lower timeframes using three RCI lines to sequentially analyze the conditions of multiple lower timeframes, and ultimately wait for the timing to buy the dip or sell the rally on the lower timeframe (= signal of mBDSR).They are described. The explanations usemore than 550 chartsin total.
Taking last week’s (September 22, 2023) USD/CAD as an example, I would like to write a little about buying the dip near the hourly uptrend line.
“RCI3 Lines + mBDSR”I think this is extremely important for effective use.
USD/CAD hourly
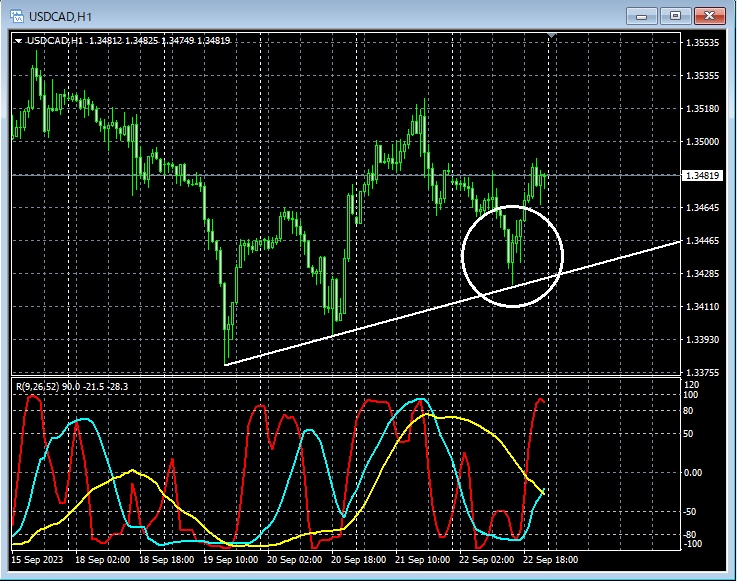
Main window:Upward trend line
Sub window: RCI three lines
If you look around the area circled in white on the hourly,Upward trend lineit has fallen close to it. It might be a situation where a rise is not surprising. I will examine the behavior around this area in more detail on the 5-minute chart.
USD/CAD 5-minute
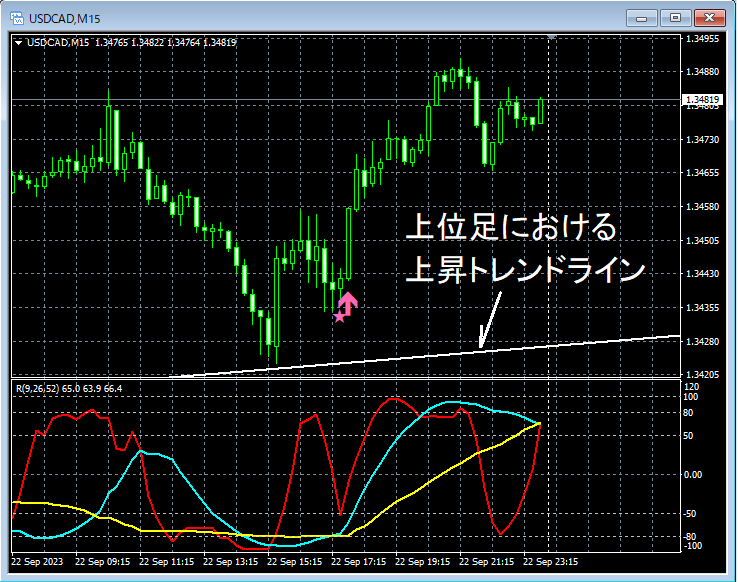
Main window:mBDSR signal (RCI two-line filter)
Hourly levelUpward trend line
Sub window: RCI three lines
On the 5-minute chart, after the hourly level’supward trend lineis pushed down and then rebounds, the subsequent pullbackmBDSR signallights up, indicating accelerating upside movement.
In the above example,the timing of the rally from the support at the higher timeframe upward trend lineis aided by themBDSR signalshowing its usefulness.
From this example,the compatibility between trendline-focused trading methodsandmBDSR signalsis evident.
※For convenience, the charts presented in this article may have added circles, lines, or rectangles, so please note.
A PDF file with 150 items is included.Many of themare examples that break down the process of logically linking higher and lower timeframes using three RCI lines to sequentially analyze the conditions of multiple lower timeframes, and ultimately wait for the timing to buy the dip or sell the rally on the lower timeframe (= signal of mBDSR).They are described. The explanations usemore than 550 chartsin total.
