

RCI3 single line and a pullback at the return high, and the sign of mBDSR
0
Indicator that shines in combination with RCI: 【BODSOR・mBDSR】
https://www.gogojungle.co.jp/tools/indicators/11836
※ an indicator developed to improve the entry precision when buying on pullbacks or selling on pullbacks using three RCI lines
150 PDF files are included.Many of them are examples where the logic links higher and lower timeframes using the three RCI lines, examines multiple lower timeframes in sequence, and finally waits for pullback buying or pullback selling timing (= signals of mBDSR) on the lower timeframe.These are documented. The explanations usemore than 550 charts.
Taking last week (September 15, 2023) GBP/AUD as an example, I would like to write a little about pullback selling near the retracement high on the 1-hour timeframe.
I think it is very important for effectively utilizing the ‘RCI3 lines + mBDSR’.
GBP/AUD Daily
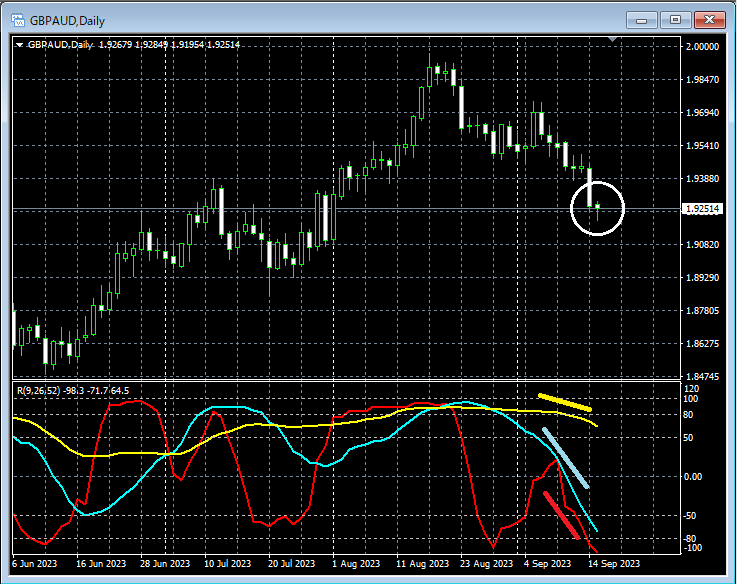
Sub-window: RCI3 lines
On the daily chart, if you look around the area circled in white,RCI3 linesare all three converging in a very weak downtrend, so it may be an area where aiming for a pullback sell on lower timeframes is not strange.
GBP/AUD 1-Hour
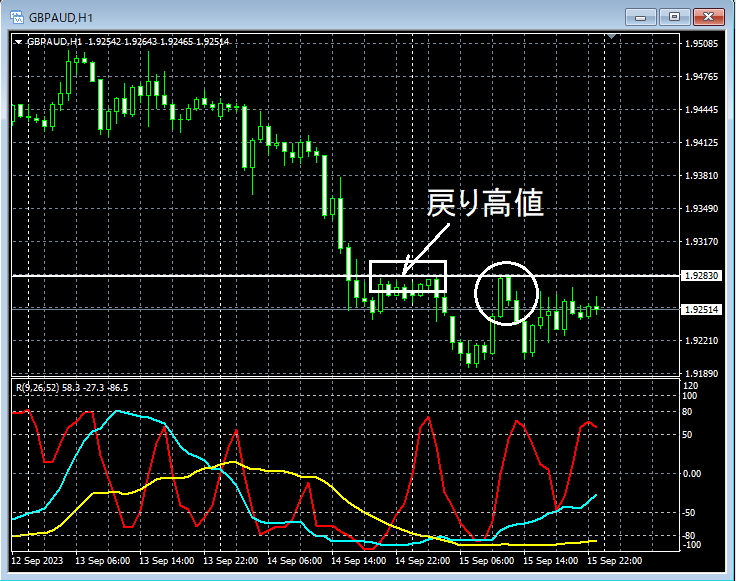
Main window: line showing pullback high
Sub-window: RCI3 lines
Looking around the circled area on the 1-hour chart,1-hour pullback highis rising nearby. Considering the daily context, it could be a scenario where a pullback sell is reasonable. We will examine the behavior around this area more closely on the 5-minute chart.
GBP/AUD 5-Minute
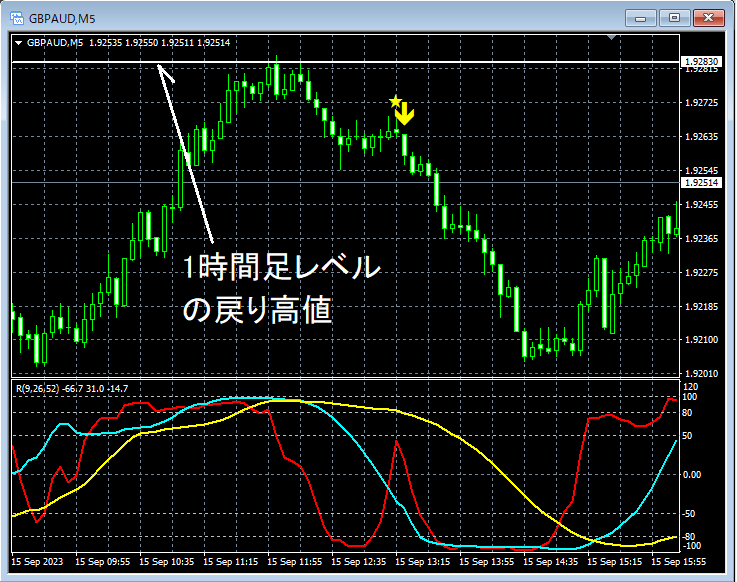
Main window: mBDSR signals (RCI two-line filter)
Line showing the 1-hour pullback high
Sub-window: RCI3 lines
On the 5-minute chart,line showing the 1-hour pullback highrises towards, then appears to retreat. In the subsequent pullbackmBDSR signallights up, indicating the downward move is accelerating.
In the above example,resistance at the pullback highand the timing of the decline on the pullback are aided by themBDSR signal.
From this,a trading method focused on the pullback highanda trading method using RCI3 linesandmBDSR signalsshow strong compatibility.
※In the charts presented in this article, for convenience in explanation, circles, straight lines, and rectangles may be drawn, so please be aware.
150 PDF files are included.Many of them are examples where the logic links higher and lower timeframes using the three RCI lines, examines multiple lower timeframes in sequence, and finally waits for pullback buying or pullback selling timing (= signals of mBDSR) on the lower timeframe.which are described. The explanations usemore than 550 charts.

× ![]()


