

RCI3 main line, EMA, notable past low, and mBDSR signals (multiple entry justification)
Indicator that shows power when combined with RCI【BODSOR・mBDSR】
https://www.gogojungle.co.jp/tools/indicators/11836
※ An indicator developed to improve entry accuracy when buying on dips or selling on rallies using the 3-line RCI
PDF files are included in 150 copies.Many of them areexamples that break down how to logically link higher and lower timeframes using the RCI 3-line, sequentially considering the status of multiple lower timeframes, and ultimately waiting for the timing of a dip buying or rally selling on the lower timeframe (i.e., the mBDSR signal).This is what they are about. The explanation usesmore than 550 charts..
Taking the pound-australia as an example from last week (as of September 13, 2023),“Reasons to sell”I would like to write a little about.
I believe it is extremely important for effectively utilizing the ‘RCI3-line + mBDSR’.
Pound-Australia Daily
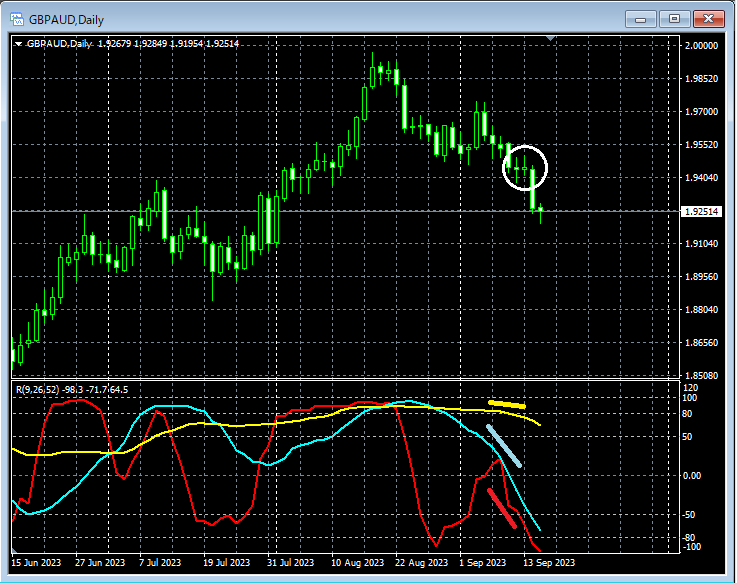
Sub-window: RCI 3-line (RCI9, RCI26, RCI52)
On the daily chart, looking at the circled area of focus,RCI 3-lineall three lines are in a very weak downward pattern, and it might be a scene where it is not strange to aim for a rebound on the lower timeframe.
Pound-Australia 4-hour
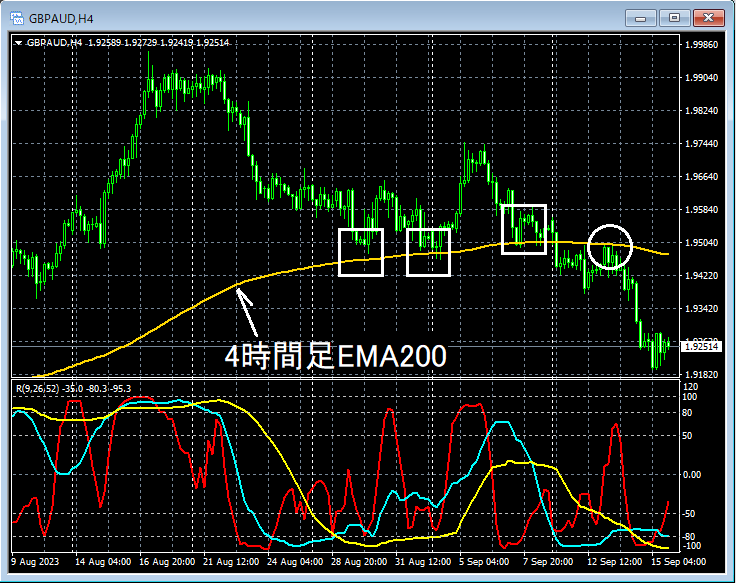
Main window: 4-hour EMA200
Sub-window: RCI 3-line
Looking at the circled area on the 4-hour chart, it had functioned as support several times4-hour EMA200after breaking below, it has retraced near the4-hour EMA200area.
Support/Resistance turnedIn thinking, it might be a scene where selling on rallies on the lower timeframe is not unreasonable.
Pound-Australia 1-hour
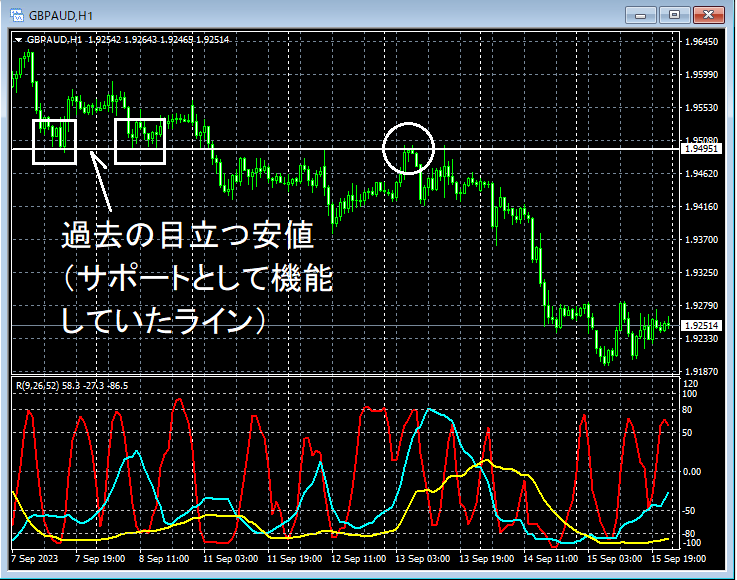
Main window: notable past lows (lines that acted as support)
Sub-window: RCI 3-line
Looking at the circled area on the 1-hour chart,Notable past lowshave been reached, so selling on rallies on the lower timeframe may not be unusual. I will take a closer look at this area using a 5-minute chart.
Pound-Australia 5-minute
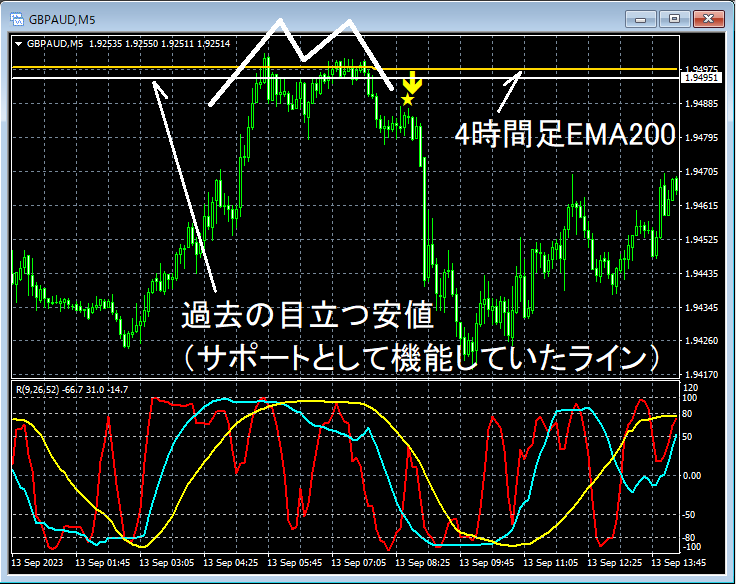
Main window: mBDSR signal (RCI 2-line filter)
Past notable lows at the 4-hour EMA200 and 1-hour levels
Sub-window: RCI 3-line
In the 5-minute chart,4-hour EMA200andpast notable lows at the 1-hour levelhave risen near,double topformed and fell. During the decline, the mBDSR signal lit up, and the decline accelerated afterward.
In this case…
〇 Daily chart is very weak
〇 It has broken below the EMA200 that was acting as support on the 4-hour chart
〇 It has retraced near where the EMA200 on the 4-hour chart and past notable lows at the 1-hour level overlap
〇 On the 5-minute chart, a double top is forming while stalling
and there are multiple overlapping reasons for selling, not just when the mBDSR rebound signal lights up.
Signaling of “mBDSR (BODSOR)”To effectively use it, as in the above example,“capture points where multiple entry reasons overlap”is important.
Also, changing perspective a little…
mBDSR can be used, for example, in the following methods
● Emphasizing moving averages as support/resistance
● Emphasizing past notable highs and lows as support/resistance
as one of the criteria for entry decisions
※ Please note that charts shown in this article may include circles, lines, or boxes for ease of explanation.
PDF files are included in 150 copies.Many of them areexamples that break down how to logically link higher and lower timeframes using the RCI 3-line, sequentially considering the status of multiple lower timeframes, and ultimately waiting for the timing of a dip buying or rally selling on the lower timeframe (i.e., the mBDSR signal).This is what they are about. The explanation usesmore than 550 charts..
