

RCI3 single line and double top-double bottom and mBDSR signals (February 13, 2023 – February 17, 2023)
Indicator that shows its power when combined with RCI【BODSOR・mBDSR】
https://www.gogojungle.co.jp/tools/indicators/11836
※ An indicator developed to improve entry accuracy when using three RCI lines for buy-the-dip or sell-the-rally trades
PDF files are attached in 150 pieces. . Most of them are examples that have been distilled into a form where multiple lower timeframes are logically linked using three RCI lines to consider the status of each lower timeframe sequentially, and finally wait for the timing to buy on dips or sell on rallies in the lower timeframe (the mBDSR signal). It is described as containing more than 550 charts in total. .
Please note that the charts shown below have been annotated with squares or lines for convenience of explanation.
2
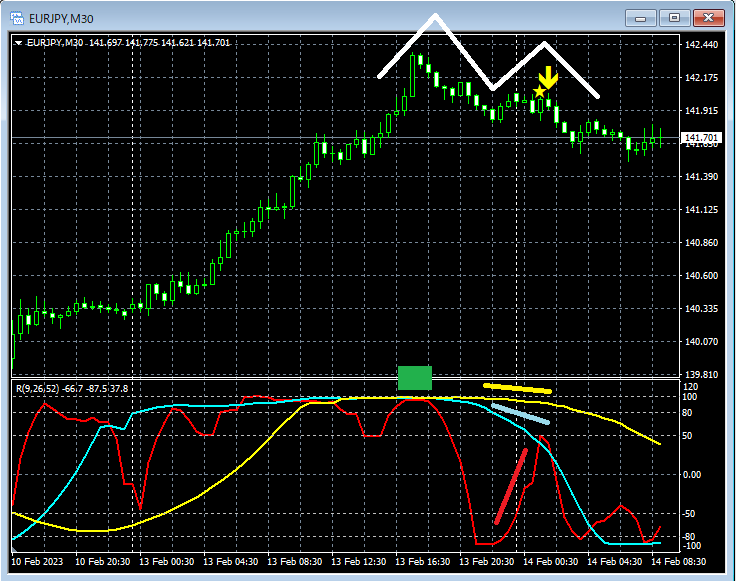
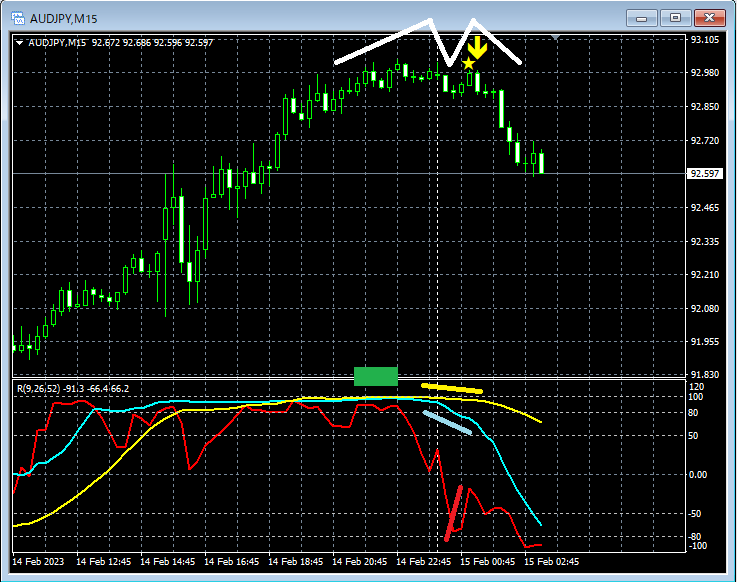
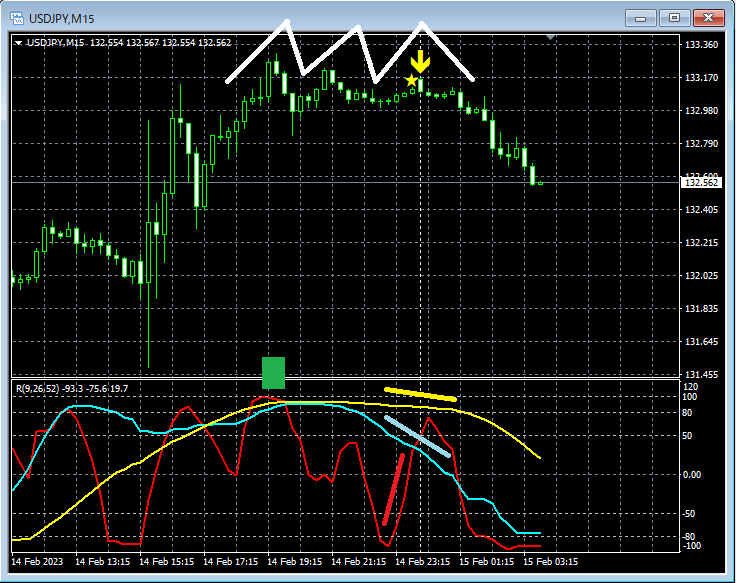
In the above example, the left side of the double top (or similar shape) rises to the level of the three-RCI-top (green square).
After that, when RCI9 dips and then rises, already RCI26 and RCI52 have begun to fall, and on the right side of the double top the mBDSR (RCI two-line filter) sell signal lights up and the price declines.
5

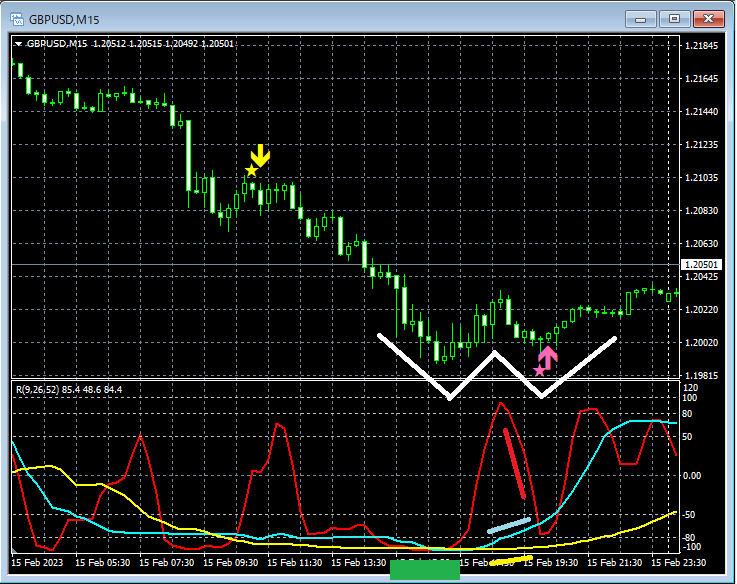
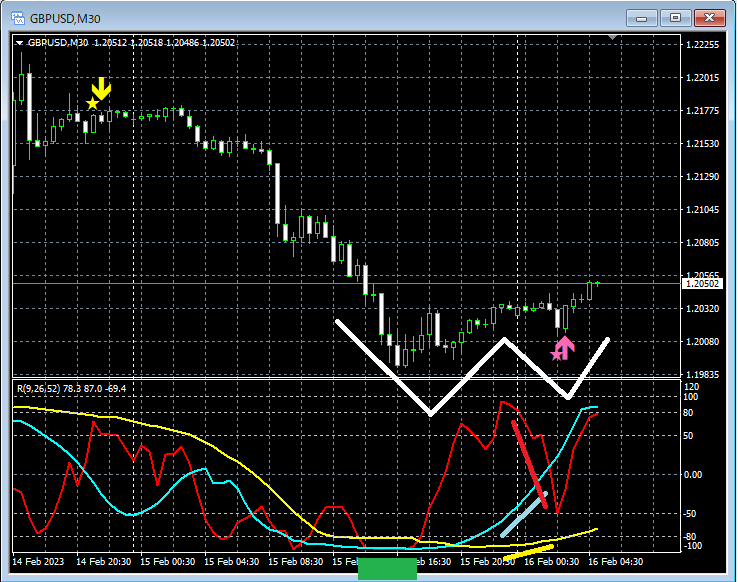
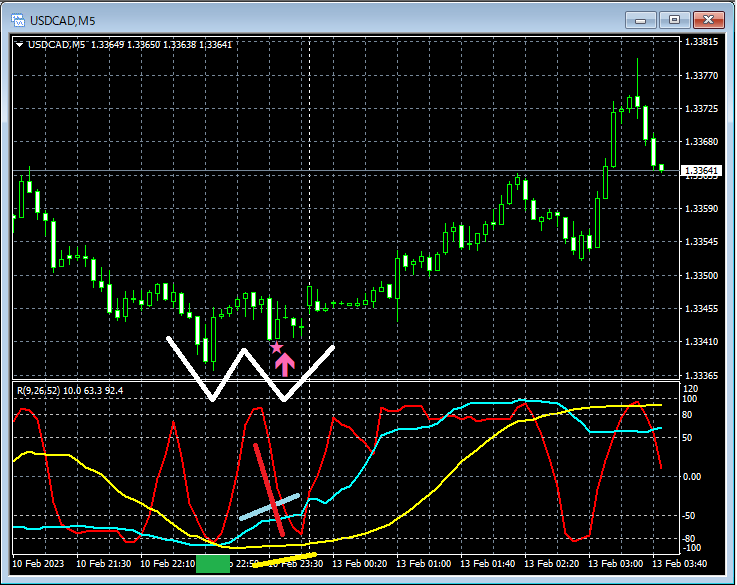
In the above example, the left side of the double bottom (or similar shape) falls to the level of the three-RCI-bottom (green square).
After that, when RCI9 rises and then falls, already RCI26 and RCI52 have begun to rise, and on the right side of the double bottom the mBDSR (RCI two-line filter) buy-the-dip signal lights up and the price rises.
Below, we will introduce several chart examples of such double tops and double bottoms (or similar shapes).
1
2

3
4
5
6
Indicator that shows its power when combined with RCI【BODSOR・mBDSR】
https://www.gogojungle.co.jp/tools/indicators/11836
※ An indicator developed to improve entry accuracy when using three RCI lines for buy-the-dip or sell-the-rally trades
PDF files are attached in 150 pieces. . Most of them are examples that have been distilled into a form where multiple lower timeframes are logically linked using three RCI lines to consider the status of each lower timeframe sequentially, and finally wait for the timing to buy on dips or sell on rallies in the lower timeframe (the mBDSR signal). It is described as containing more than 550 charts in total. .


