Today's Scenario EUR/JPY
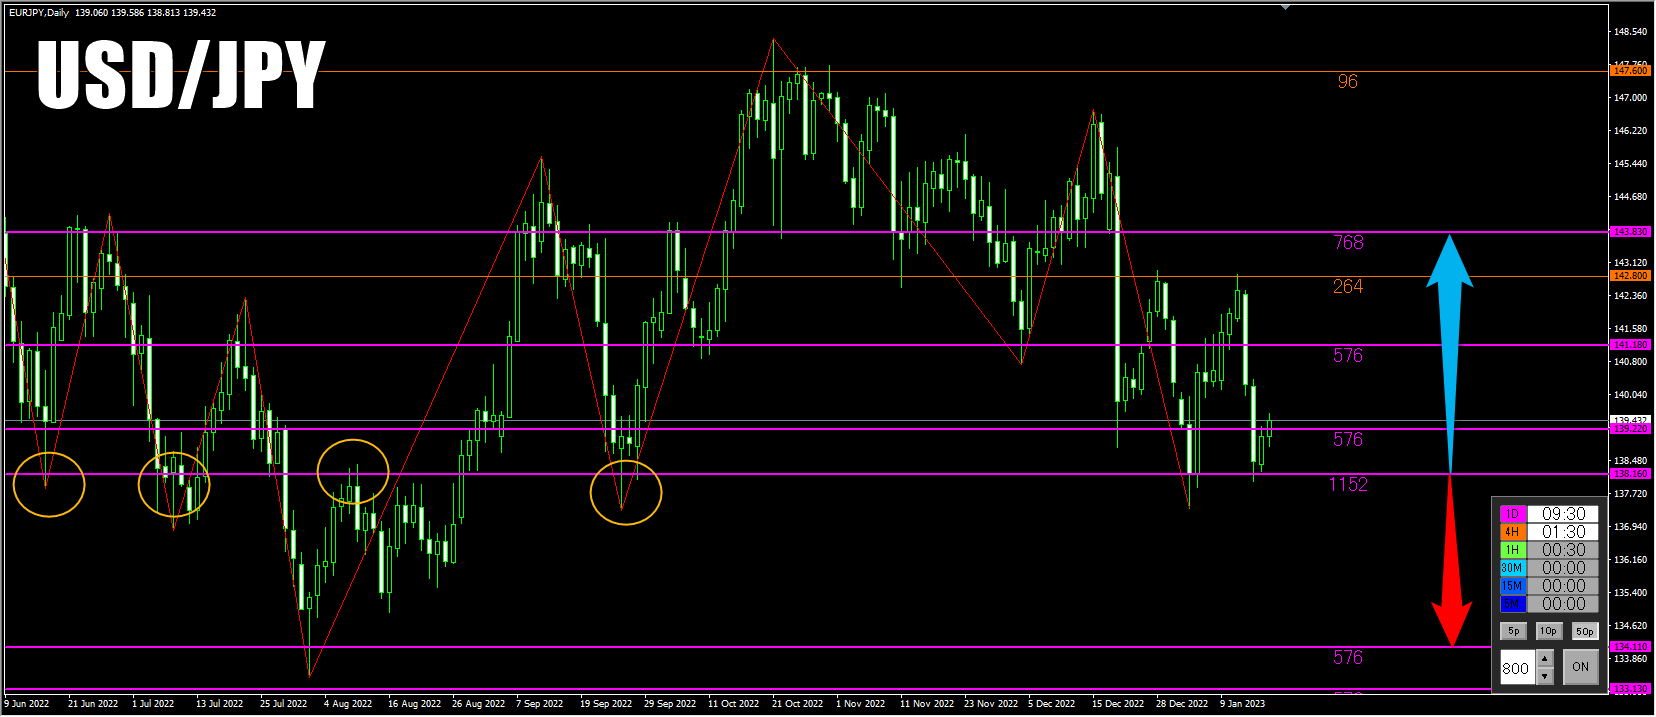
EUR/JPY Daily Chart
A line that is watched on the daily chart (purple 1152) has recently formed wicks and touched it twice.
This is a line that has been quite important in the past as well.
From here, it is a pivotal moment whether the hard line will be broken to continue the downtrend, or be bounced and rise again or shift into an uptrend.

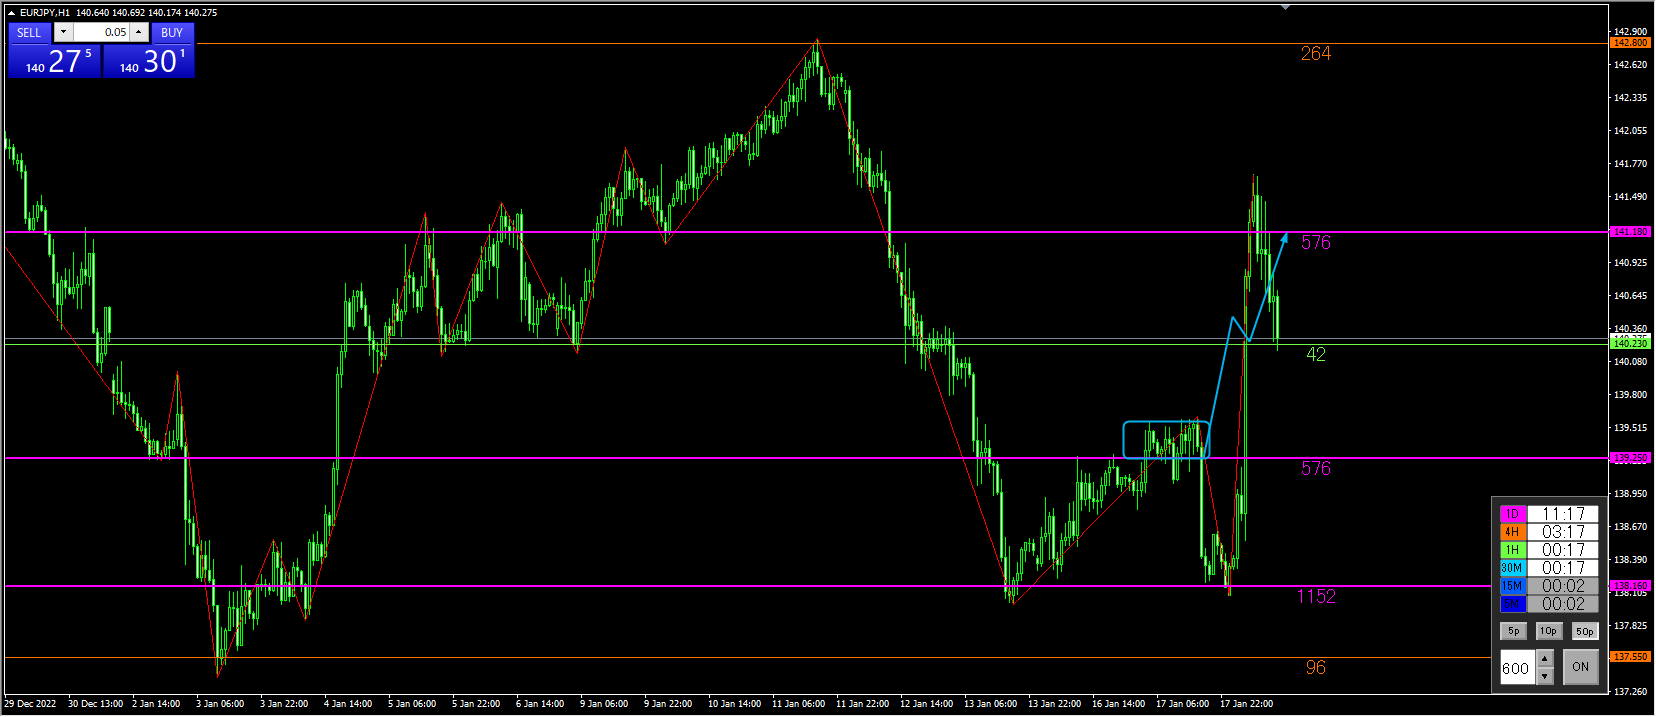
1-hour chart
Going down to the lower time frame shows an upward trend beyond the milestone line (purple 1152).
The price is near the line watched on the daily chart (purple 576) and is looking to see whether the body will break above it, form a pullback, and rise further.
On a 1-hour basis, with a buy bias and confirmation of an uptrend, target higher on the next 1-hour line (green 36) around 140.16, setting TP near 139.433 and SL accordingly for entry.

15-minute chart
The entry trigger is on the 15-minute chart.
The area around the blue line above the purple line (576) is a range.
I am considering entering at the moment the candlestick body breaks above the blue line.
There is talk about policy interest rates. Normally I don't pay much attention, but it is necessary to also consider fundamentals.

If the move clearly shifts to an uptrend from the blue rectangle, I planned to consider an entry following the blue arrows’ up-scenario, but
during sleep, the price fell contrary to expectations and reversed, so there was no entry.
Although the expected scenario did not unfold, the “Line Scouter” resistance-support lines are clearly effective.
Regarding the Bank of Japan policy rate, an unexpectedly large move was anticipated, so even if I entered, I would consider a small lot size.
Since I do not monitor charts all day, I could not trade, but using the Line Scouter’s resistance-support lines as guidance
it is a chart pattern that can yield profits.