

RCI 3-line and double top-double bottom and mBDSR signals (October 3–7, 2022)
Indicator that shines when combined with RCI【BODSOR・mBDSR】
https://www.gogojungle.co.jp/tools/indicators/11836
※ An indicator developed to enhance entry accuracy when using three-line RCI to buy on dips or sell on rallies
PDF files are attached: 150 items. Most of them are examples that have been distilled into a form that links higher and lower timeframes logically using three-line RCI, then sequentially considers the status of multiple lower timeframes, and finally waits for the timing of dips-buy or rallies-sell on the lower timeframe (= mBDSR signal). The explanation uses more than 550 charts .
Please note that the charts shown below have had squares or lines added for ease of explanation.
1
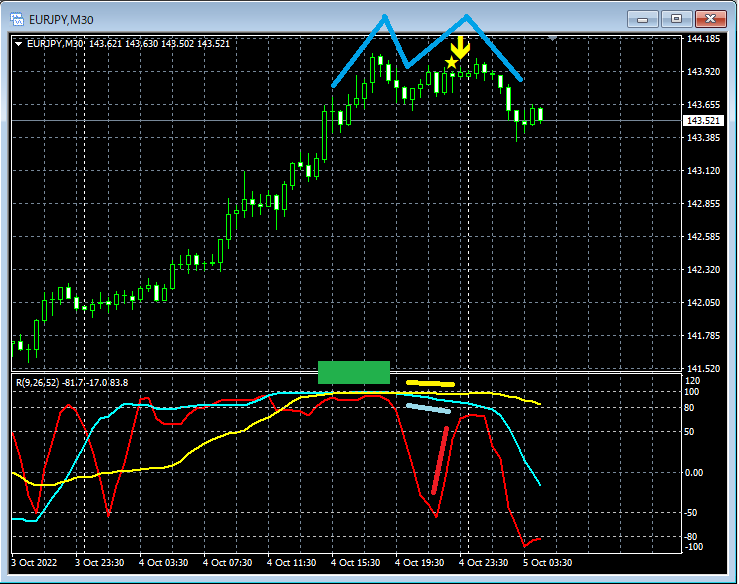
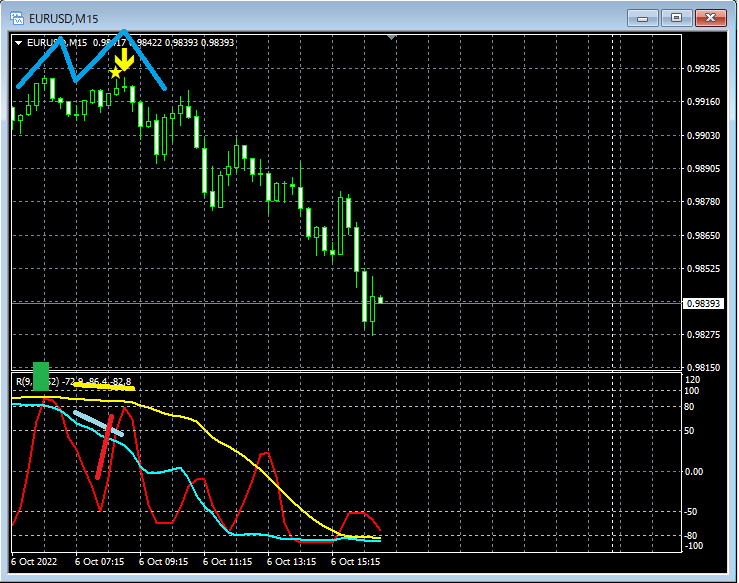
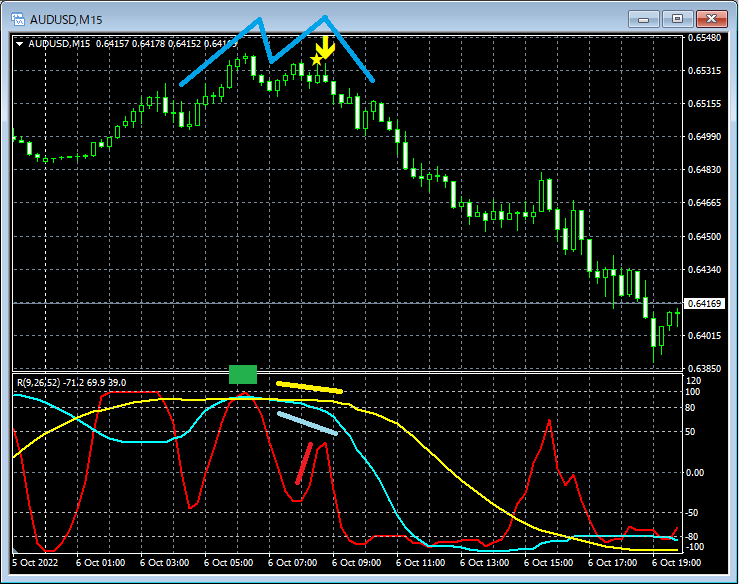
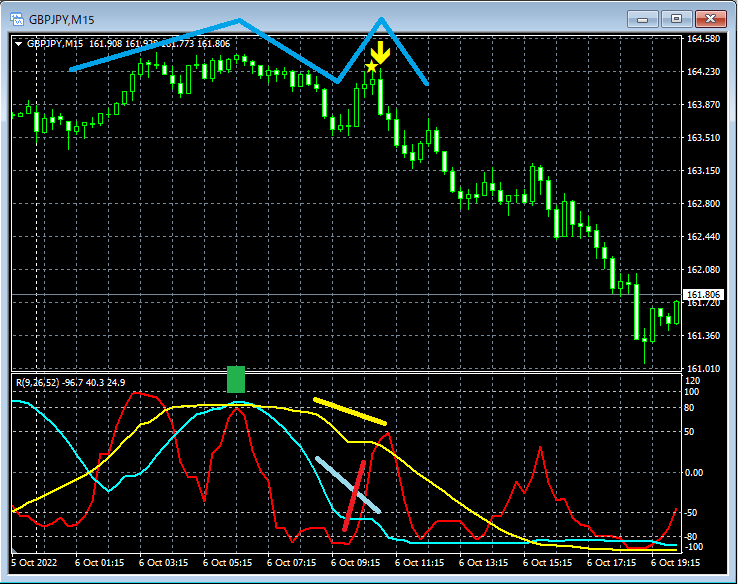
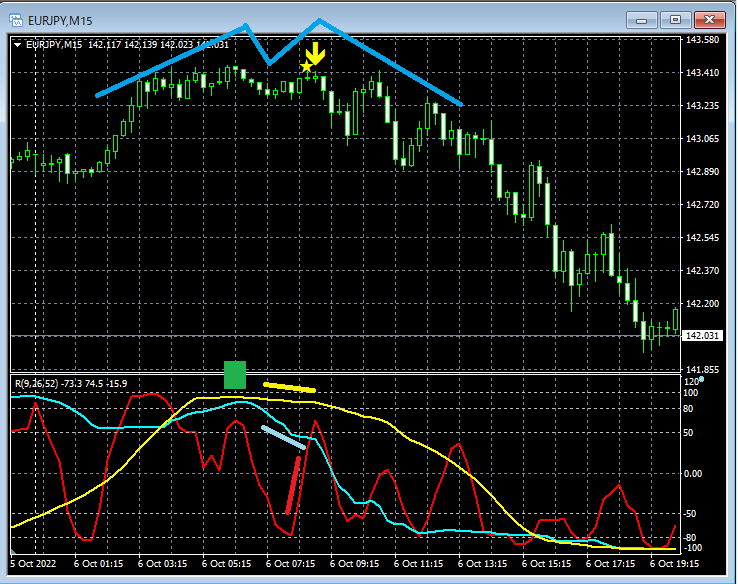
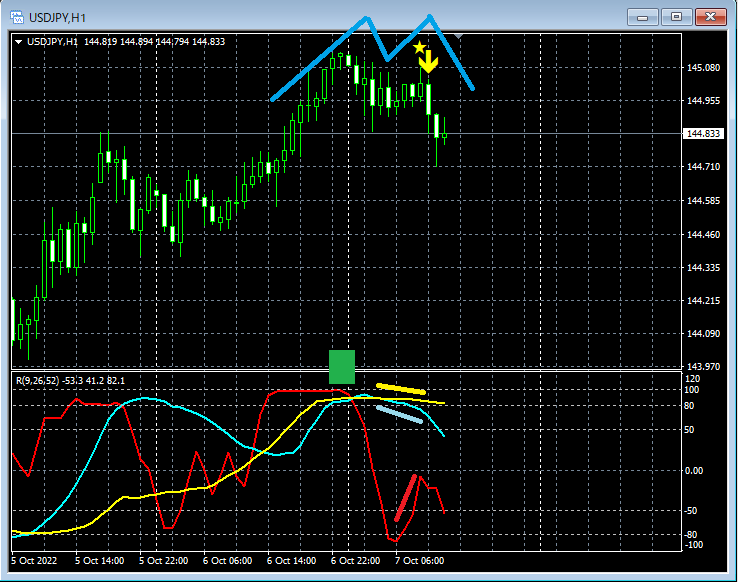
In the above example, the left peak of the double top (or similar shape) rises up to the form of three-line RCI top (green square).
Later, when RCI9 dips first and then rises, RCI26 and RCI52 have already turned down, and on the right peak of the double top the mBDSR (two-line RCI filter) sell signal for the pullback lights up and the price declines.
2
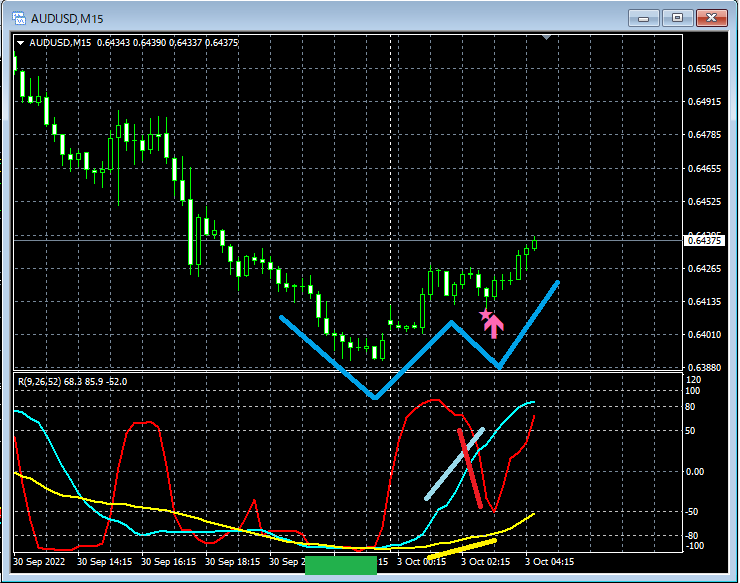
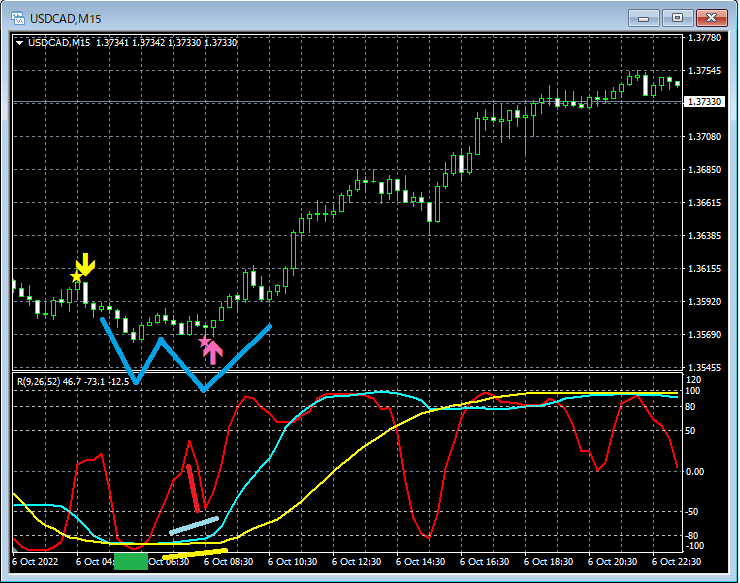
In the above example, the left valley of the double bottom (or similar shape) drops to the form of three-line RCI bottom (green square).
Then, as RCI9 rises first and then falls, RCI26 and RCI52 have already turned up, and on the right valley of the double bottom the mBDSR (two-line RCI filter) pullback buy signal lights up and the price rises.
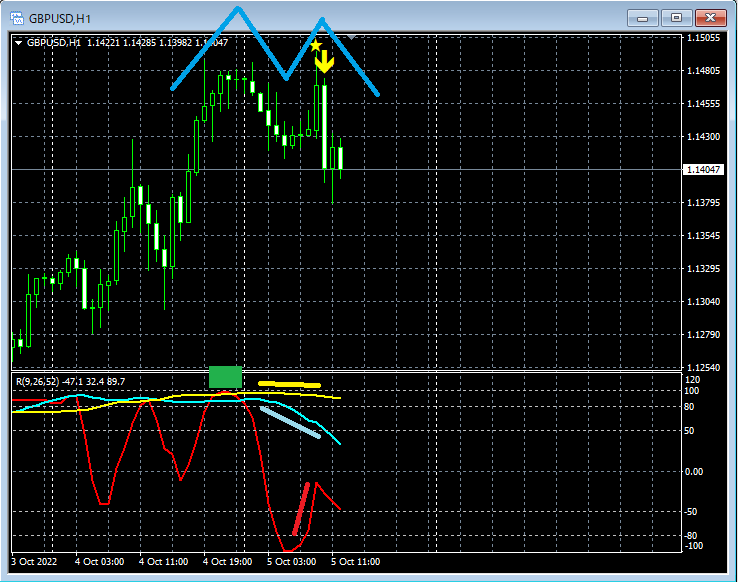
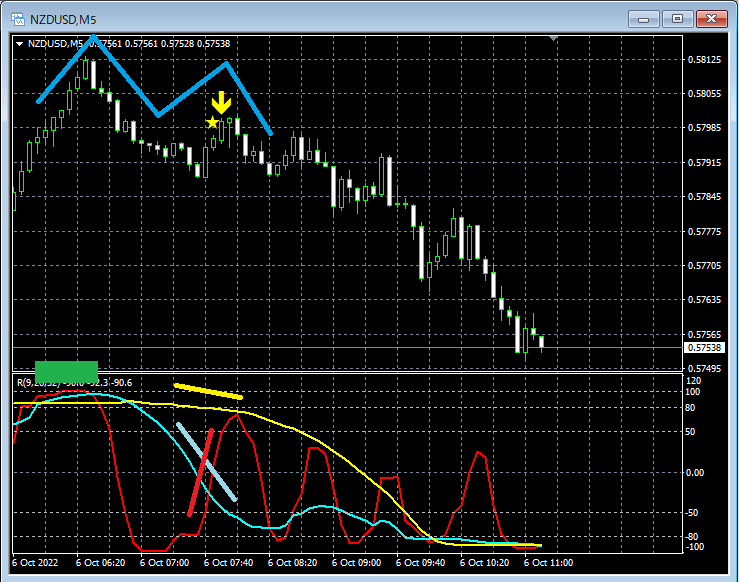
Below, we introduce several such chart examples of double tops and double bottoms (or shapes similar to them).
3
4
5
6
7
8
9
10
Indicator that shines when combined with RCI【BODSOR・mBDSR】
https://www.gogojungle.co.jp/tools/indicators/11836
※ An indicator developed to enhance entry accuracy when using three-line RCI to buy on dips or sell on rallies
PDF files are attached: 150 items. Most of them are examples that have been distilled into a form that links higher and lower timeframes logically using three-line RCI, then sequentially considers the status of multiple lower timeframes, and finally waits for the timing of dips-buy or rallies-sell on the lower timeframe (= mBDSR signal). The explanation uses more than 550 charts .


