

"RCI3 Three-Line + mBDSR" ~ Sell on the rebound near the neckline of the three heads ~
Indicator that shows power in combination with RCI【BODSOR・mBDSR】
https://www.gogojungle.co.jp/tools/indicators/11836
※ An indicator developed to improve entry accuracy when using three RCI lines for breakout buys on pullbacks or sell-offs on retracements
PDF files are included 150 pieces. Most of them are examples that break down the process of logically linking higher and lower timeframes using the three RCI lines, then sequentially considering the conditions of multiple lower timeframes, and finally waiting for the timing of pullback buys or retracement sells on the lower timeframe (the mBDSR signal). The explanation uses more than 550 charts .
AUDCAD 30-minute chart
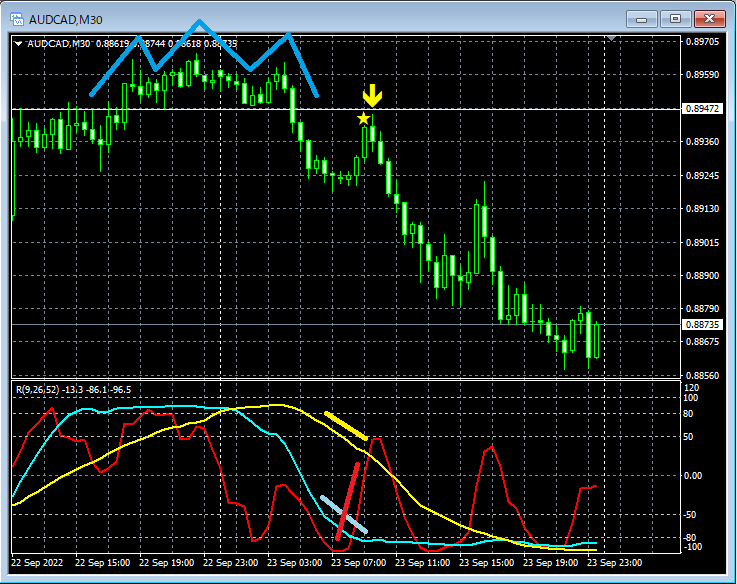
From the upper chart, around the point where the head-and-shoulders neckline breaks, RCI52 begins to turn downward. As it retraces toward near the neckline, RCI26 and RCI52 both clearly decline, while only RCI9 rises. At this moment, if RCI9 also turns downward, all three RCI lines would be in a weak-down formation, which is a possible scenario.
In such a situation, the mBDSR (RCI two-line filter) retracement sell signal lights up and the price declines.
Indicator that shows power in combination with RCI【BODSOR・mBDSR】
https://www.gogojungle.co.jp/tools/indicators/11836
※ An indicator developed to improve entry accuracy when using three RCI lines for breakout buys on pullbacks or sell-offs on retracements
PDF files are included 150 pieces. Most of them are examples that break down the process of logically linking higher and lower timeframes using the three RCI lines, then sequentially considering the conditions of multiple lower timeframes, and finally waiting for the timing of pullback buys or retracement sells on the lower timeframe (the mBDSR signal). The explanation uses more than 550 charts .


