

"RCI3 Triple Line + mBDSR" ~ Aiming for a rebound near noticeable highs ~
Indicator that shines in combination with RCI: 【BODSOR・mBDSR】
https://www.gogojungle.co.jp/tools/indicators/11836
※ An indicator developed to improve entry accuracy when using the three-RCI lines for buying on dips or selling on rallies.
PDF files are included: 150 files. Most of them are examples that break down how to logically link higher and lower timeframes using the three RCI lines, then sequentially consider multiple lower timeframes, and finally wait for the timing to buy on dips or sell on rallies on the lower timeframe (the mBDSR signal). It is described as such. The explanations use more than 550 charts .
NZDUSD 1-hour chart

From the above chart, you can see that you can draw a horizontal line by connecting notable highs. This line, which previously acted as resistance, may now function as support.
We will look at the area enclosed by the white box on the lower timeframe.
NZDUSD 5-minute chart
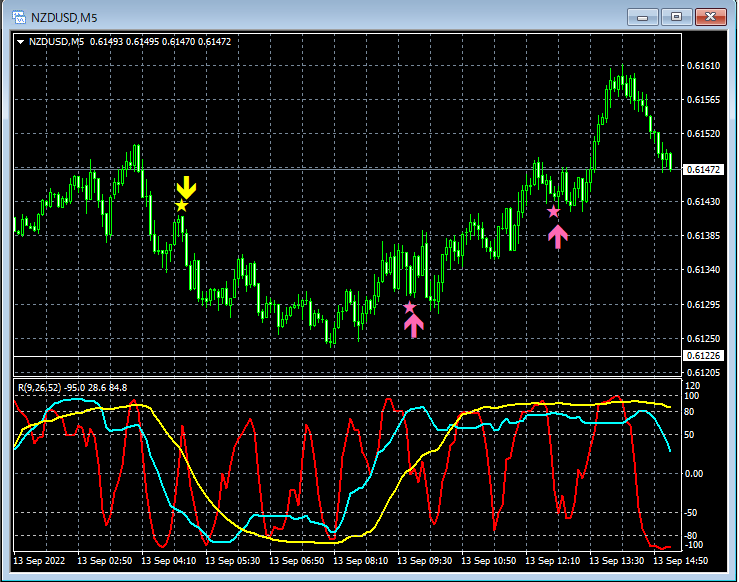
Looking at the 5-minute chart above, the price fell to near the horizontal line after the mBDSR (RCI two-line filter) sell-off signal, then rebounded from around that area. While rising, two dip-buy signals appeared.
Indicator that shines in combination with RCI: 【BODSOR・mBDSR】
https://www.gogojungle.co.jp/tools/indicators/11836
※ An indicator developed to improve entry accuracy when using the three-RCI lines for buying on dips or selling on rallies.
PDF files are included: 150 files. Most of them are examples that break down how to logically link higher and lower timeframes using the three RCI lines, then sequentially consider multiple lower timeframes, and finally wait for the timing to buy on dips or sell on rallies on the lower timeframe (the mBDSR signal). It is described as such. The explanations use more than 550 charts .


