
RCI3 single line and double top, double bottom, and mBDSR signal
An indicator that shows its power when used in combination with RCI【BODSOR・mBDSR】
https://www.gogojungle.co.jp/tools/indicators/11836
※ An indicator developed to improve entry accuracy when using three RCI lines for buying on pullbacks or selling on retracements
150 PDF files are included. Many of them are examples that have been distilled into a form that analyzes the conditions of multiple lower timeframes sequentially by linking the higher and lower timeframes logically using three RCI lines, and finally waits for the pullback buy timing or retracement sell timing on the lower timeframe (= signals of mBDSR). A total of over 550 charts have been used in the explanations.
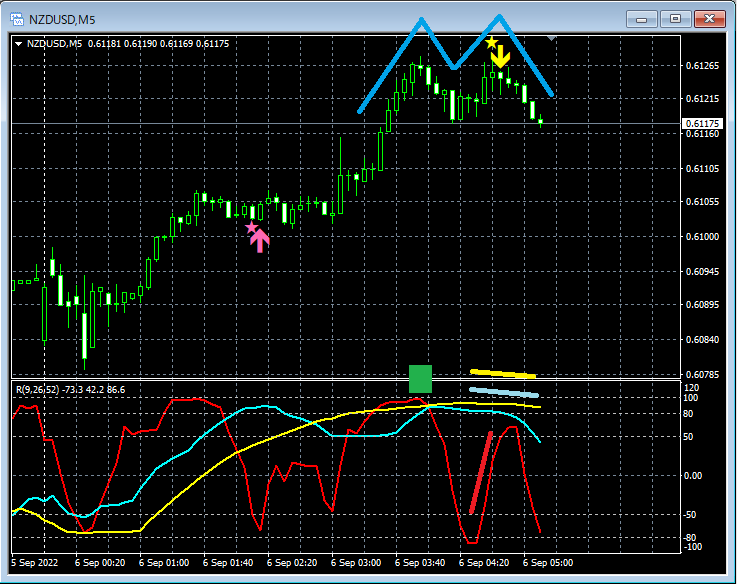
Please note that in the charts shown below, squares or lines have been drawn for convenience of explanation.
1

In the above example, the left peak of the double top rises to the shape of a three-line RCI high (green square).
After that, when RCI9 falls and then rises, RCI26 and RCI52 have already turned downward, and on the right peak of the double top, the mBDSR (two-RCI filter) retracement sell signal lights up and the price declines.
2

In the above example, the left trough of the double bottom falls to the shape of a three-line RCI low (green square).
After that, when RCI9 rises and then falls, RCI26 and RCI52 have already turned upward, and on the right trough of the double bottom, the mBDSR (two-RCI filter) pullback buy signal lights up and the price rises.
Below, several such double-top and double-bottom chart examples are shown.
3

4

5

6

7

An indicator that shows its power when used in combination with RCI【BODSOR・mBDSR】
https://www.gogojungle.co.jp/tools/indicators/11836
※ An indicator developed to improve entry accuracy when using three RCI lines for buying on pullbacks or selling on retracements
150 PDF files are included. Many of them are examples that have been distilled into a form that analyzes the conditions of multiple lower timeframes sequentially by linking the higher and lower timeframes logically using three RCI lines, and finally waits for the pullback buy timing or retracement sell timing on the lower timeframe (= signals of mBDSR). A total of over 550 charts have been used in the explanations.
