

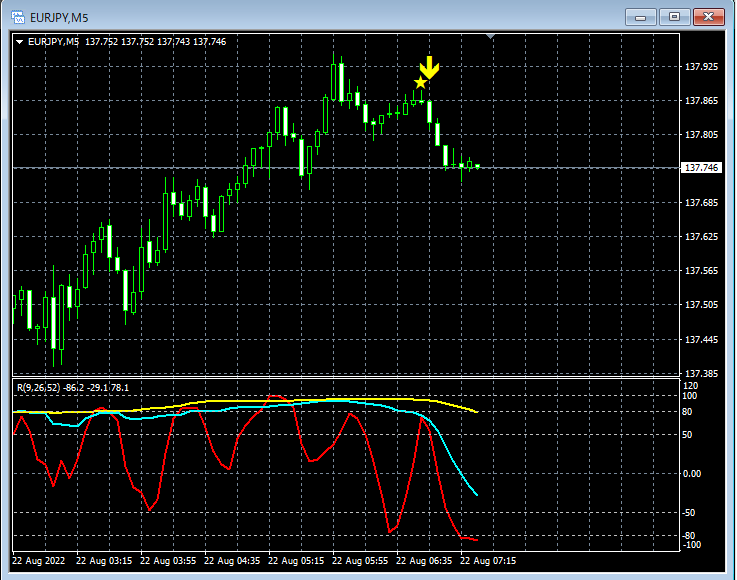
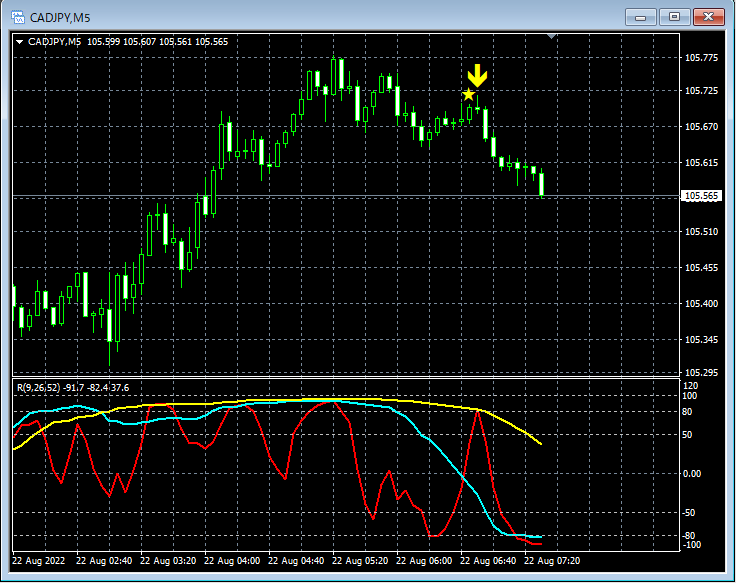
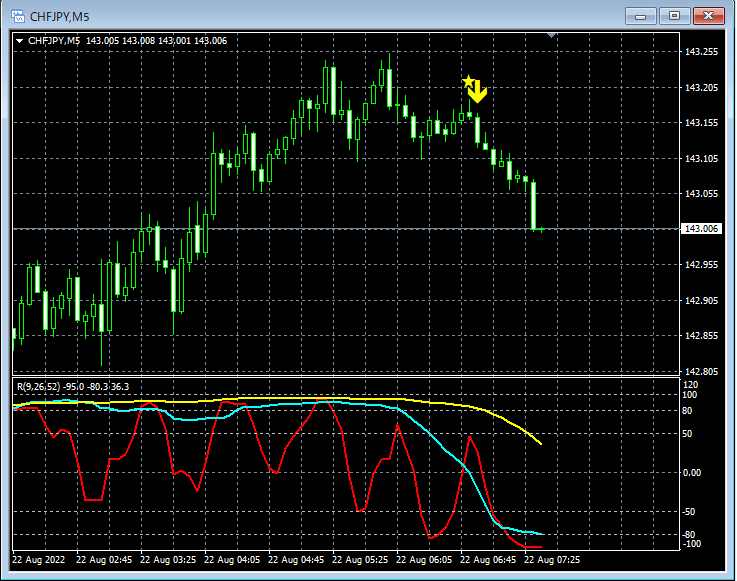
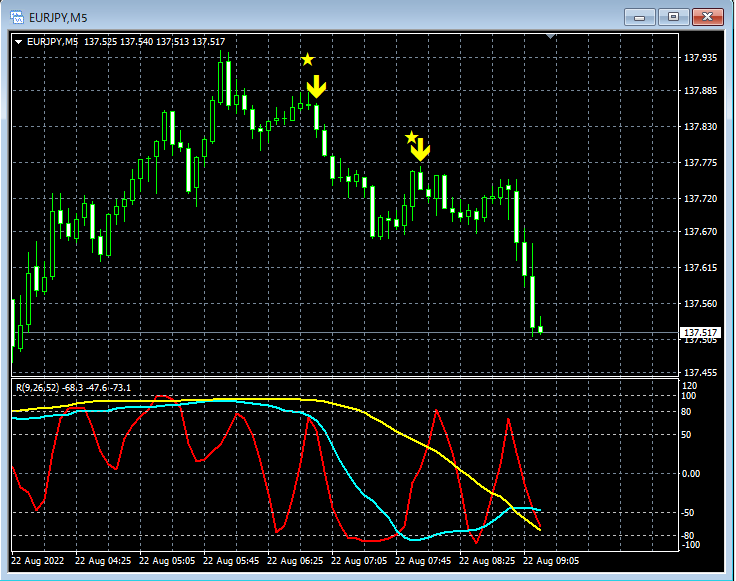
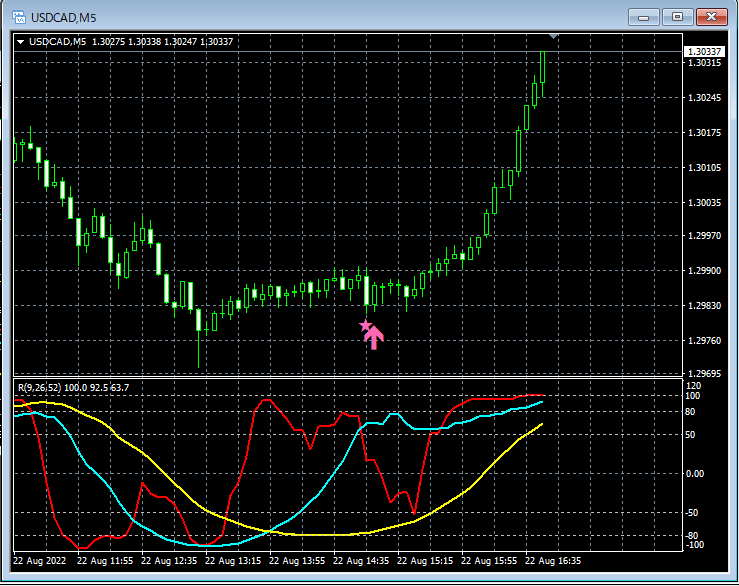
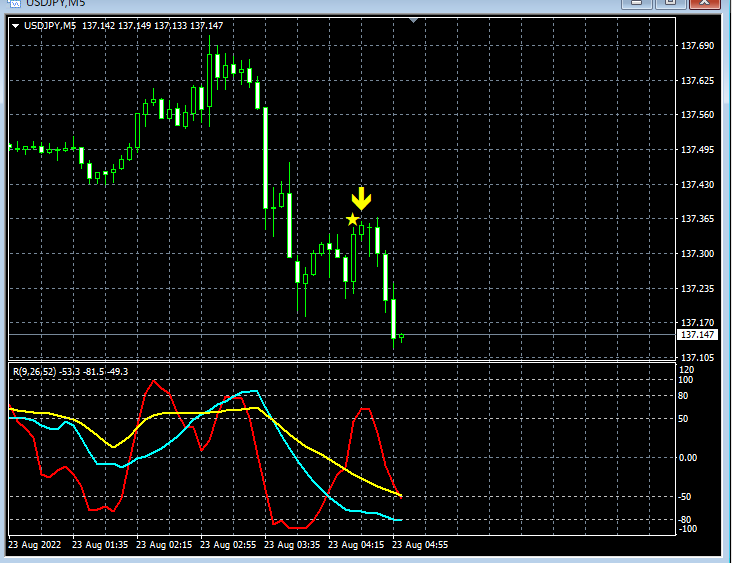
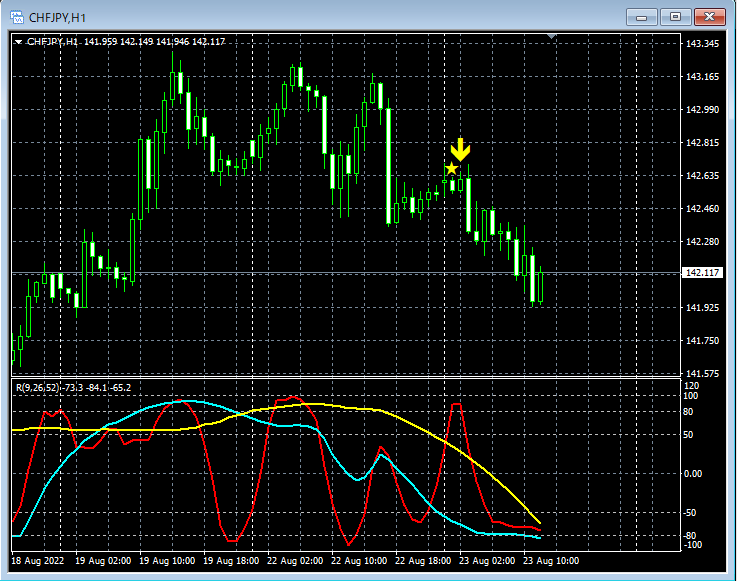
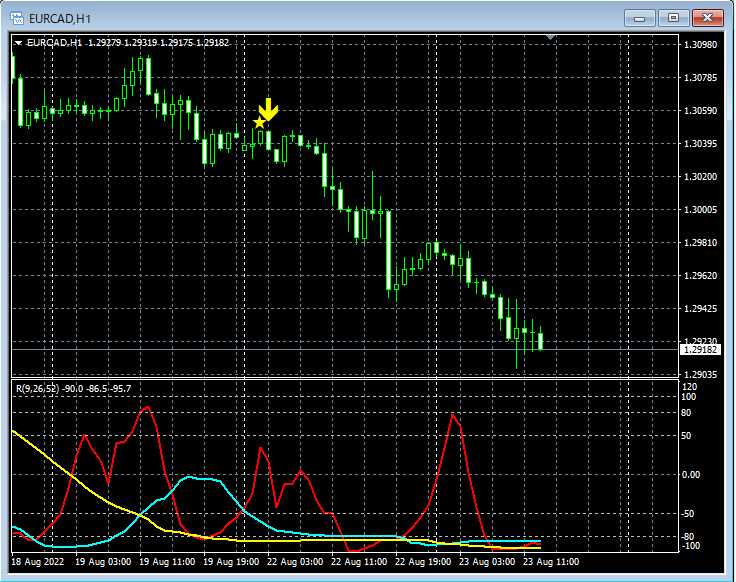
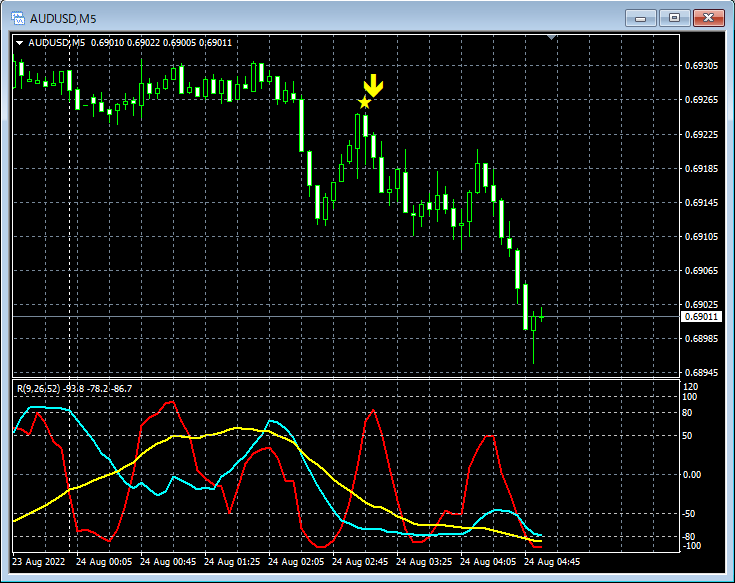
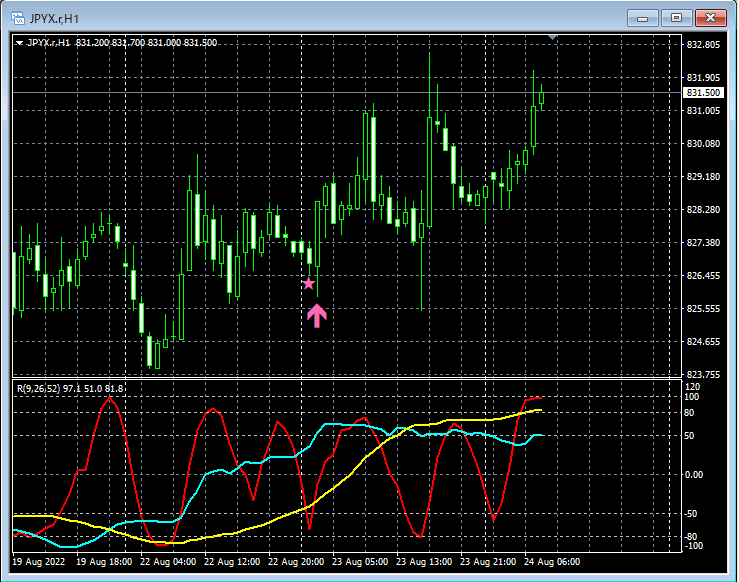
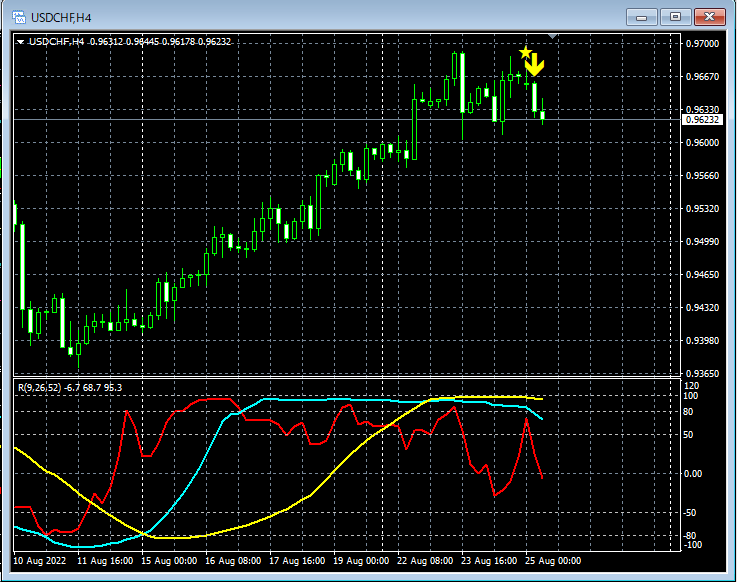
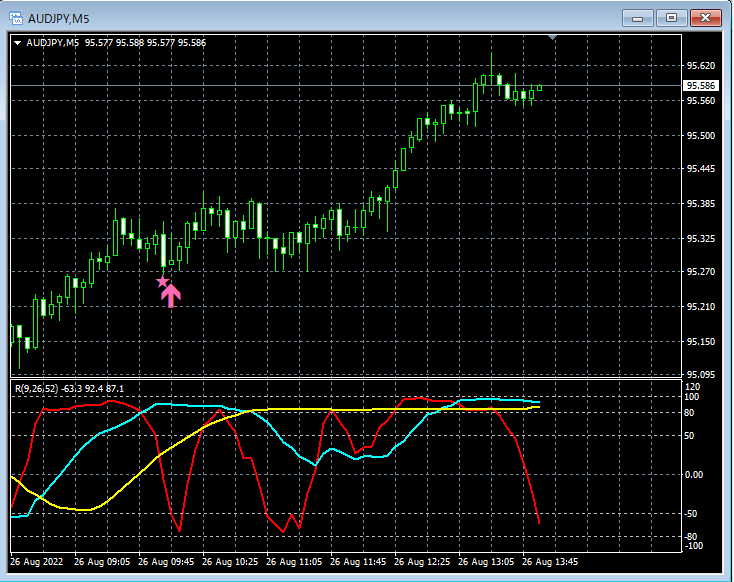
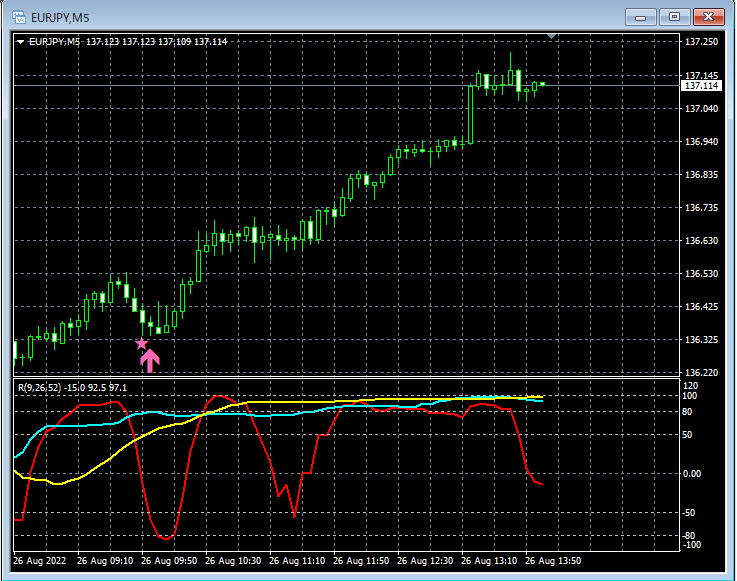
■ [Example of RCI3 three-line + mBDSR sign] (August 22 to August 26)
Indicator that shows power when used in combination with RCI: BODSOR・mBDSR
https://www.gogojungle.co.jp/tools/indicators/11836
An indicator developed to improve entry accuracy when using three RCI lines for buying on pullbacks or selling on rallies.
The PDF file contains 150 items. Many of them are examples that summarize how, by logically linking the higher and lower timeframes using the three RCI lines, multiple lower timeframes are sequentially analyzed, ultimately waiting for the timing to buy on pullbacks or sell on rallies on the lower timeframe (i.e., the mBDSR signal). In the explanations, more than 550 charts are used.
1
2
3
4
5
6
7
8
9
10
11
12
13
14
15
16
17
18
19

20
21
22
23
Indicator that shows power when used in combination with RCI: BODSOR・mBDSR
https://www.gogojungle.co.jp/tools/indicators/11836
An indicator developed to improve entry accuracy when using three RCI lines for buying on pullbacks or selling on rallies.
The PDF file contains 150 items. Many of them are examples that summarize how, by logically linking the higher and lower timeframes using the three RCI lines, multiple lower timeframes are sequentially analyzed, ultimately waiting for the timing to buy on pullbacks or sell on rallies on the lower timeframe (i.e., the mBDSR signal). In the explanations, more than 550 charts are used.


