

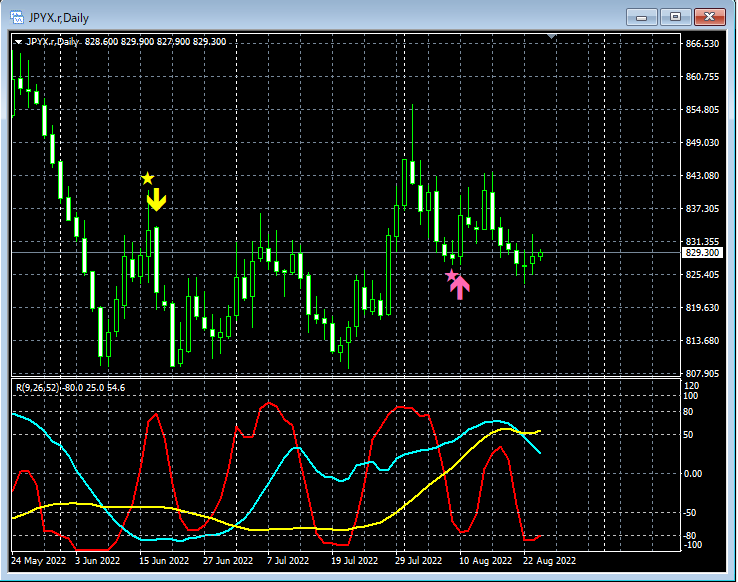
■ In the Yen Index, an example of [RCI three-line + mBDSR sign]
Indicator that shines in combination with RCI: 【BODSOR・mBDSR】
https://www.gogojungle.co.jp/tools/indicators/11836
※ An indicator developed to improve entry accuracy when using three RCI lines for buying on dips or selling on rallies
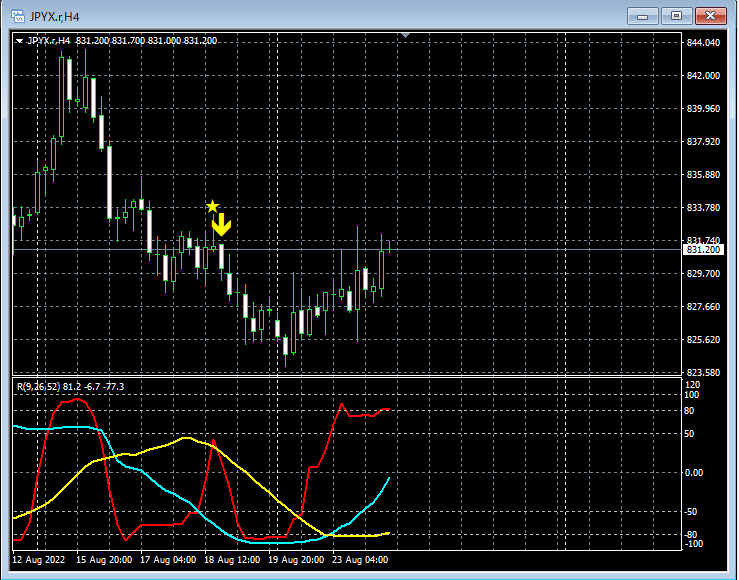
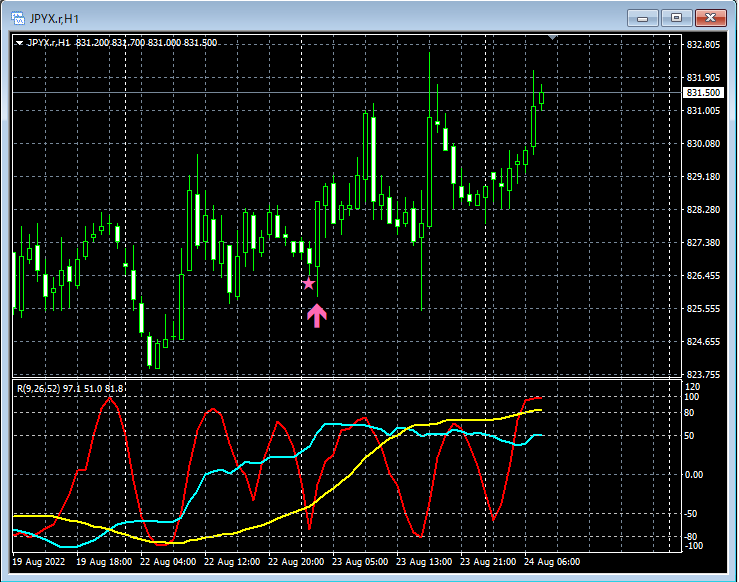
150 PDF files are included. Many of them are examples that break down the process of logically linking higher and lower timeframes using three RCI lines, eventually considering the status of multiple lower timeframes step by step and waiting for the timing of buying on dips or selling on rallies in the lower timeframe (= mBDSR signal). There are. It is described that there are more than 550 charts used in the explanations. Below, we present examples of mBDSR signals (RCI two-line filter version) in the most recent yen index.
4-hour chart
1-hour chart
Indicator that shines in combination with RCI: 【BODSOR・mBDSR】
https://www.gogojungle.co.jp/tools/indicators/11836
※ An indicator developed to improve entry accuracy when using three RCI lines for buying on dips or selling on rallies
150 PDF files are included. Many of them are examples that break down the process of logically linking higher and lower timeframes using three RCI lines, eventually considering the status of multiple lower timeframes step by step and waiting for the timing of buying on dips or selling on rallies in the lower timeframe (= mBDSR signal). There are. Explanation mentions more than 550 charts are used in the explanations.


