
◆RCI and mBDSR and various chart patterns
Indicator that shines when combined with RCI【BODSOR・mBDSR】
https://www.gogojungle.co.jp/tools/indicators/11836
※ An indicator developed to improve entry accuracy when using three RCI lines for buy-the-dips or sell-the-rallies.
PDF files are attached in 150 items. Many of them are examples that, by logically linking higher and lower timeframes using three RCI lines, sequentially examine the状況 of multiple lower timeframes and ultimately arrive at signals for dip buys or rally sells on the lower timeframe (= mbDSR signals). It is: explanations include more than 550 charts used.
1
(Minor) Buy-the-dip signal appeared on the pullback after breaking below a minor uptrend line.
2
Break above a downtrend line → dip-buy signal lights up → then rises.
3
After breaking above a downtrend line, a dip-buy signal lights up.
4
After breaking above a downtrend line, a dip-buy signal lights up.
5
Two rally-sell signals light up. The second signal lights up on a pullback after breaking below a rising trend line.
6
Around the previous day's high (white horizontal line). After breaking the downtrend line, a pullback to rise and a rally-sell signal lights up. And it falls. (Double top.)
7
After breaking above a downtrend line, a pullback triggers a dip-buy signal. And it rises.
8
After breaking above a downtrend line, a pullback triggers a dip-buy signal. And it rises.
9
After breaking above a downtrend line, a pullback triggers a dip-buy signal. And it rises.
10
Once the rising trend line is broken, a rally-sell signal lights up and price falls. Resulting in a decline from the double top.
11
After breaking a rising trend line, a rally-sell signal lights up. And it falls.
12
After rising toward a historically respected horizontal line, a rally-sell signal lights up and price falls. (Support/Resistance turning.)
13
After breaking above a downtrend line, a dip-buy signal lights up. And it rises.
14
It pulled back near the EMA21 on the 1-hour chart, then a dip-buy signal lights up. And it rises.
15
Two dip-buy signals light up. The second lights up on a pullback after breaking above a downtrend line.
16
Note on 15
Rising from daily RCI9 in an uptrend, rising from 4-hour EMA21 (yellow line) to daily EMA21 (blue line).
17
After breaking above a downtrend line, a dip-buy signal lights up and price rises.
18
After breaking below a rising trend line, a rally-sell signal lights up. Then it falls. The behavior of the double top and the three RCI lines is interesting to compare.
19
After the 5-minute signals described earlier, the 15-minute also lights up a rally-sell signal and falls.
20
From a dip-buy signal, price rose toward but then fell back near a historically watched horizontal line. A break of the rising trend line followed. A rally-sell signal lights up on the subsequent pullback and price declines.
21
Price rose toward the historically watched horizontal line but faced resistance and fell back. Broader rise-to-fall pattern with a break of the rising trend line. Rally-sell signal lights up on the retracement and price drops.
22
Price fell toward a historically watched horizontal line, then rebounded. Break above the counter-trend line, then a pullback lights up a dip-buy signal and it rises.
23
After breaking below a rising trend line, a rally-sell signal lights up on the pullback.
Background:
Daily RCI9 is in a ceiling zone.
In four-hour, 1-hour, 30-minute, 15-minute, and 5-minute charts, this is the so-called RCI3 triple-top.
24
Price rises toward a historically watched horizontal line. RCI three lines rise to what is called a triple-top, then fall. On the subsequent pullback, a rally-sell signal lights up. And price declines.
25
Note on GBPCHF previously. On the 5-minute chart, signals appear earlier than on the 15-minute chart. Price rises toward a historically watched horizontal line. RCI three lines rise to a so-called triple-top and then fall. After breaking the rising trend line, a rally-sell signal lights up on the retracement.
26
Yesterday, there was defense around this horizontal line as well. On the 30-minute chart, a rally-sell signal lights up → price dips → breaks the horizontal line → on the retracement, a dip-buy signal lights up.
27
Break above the counter-trend line. On the pullback, a dip-buy signal lights up. And price rises.
In four hours, all three RCI lines rise, showing a strong setup
In the 1-hour chart, only RCI9 clearly declines, etc.
It wouldn't be strange to consider a dip-buy here
28
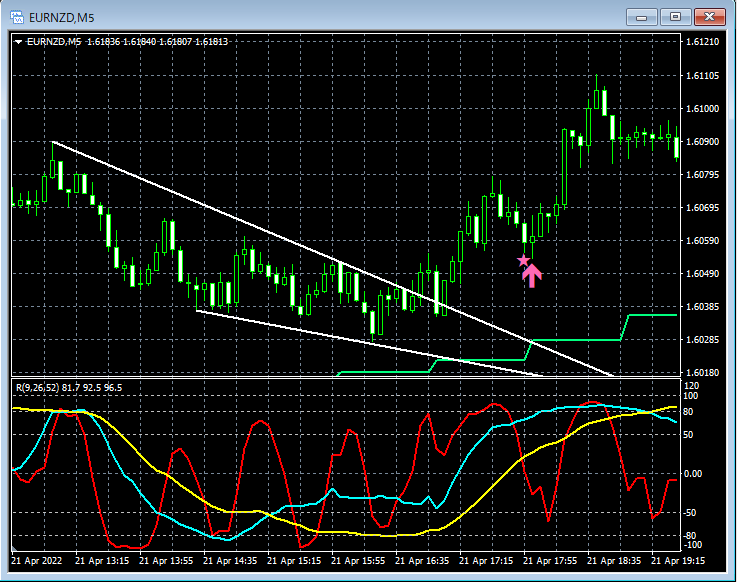
Earlier note on EURNZD 5-minute. A wedge forms. It does not fall to the 1-hour EMA21, but rebounds. During the wedge, RCI52 dips toward the low region as well.
29
Here price revives from a line that has been hard to overcome. A rally-sell signal lights up along the way.
30
Reaches a line historically watched, rally-sell signal lights up, and price falls.
31
After breaking the double-top neck line, a rally-sell signal lights up on the pullback. And price falls.
32
After breaking the double-top neck line, a rally-sell signal lights up on the pullback. And price falls.
33
Earlier note on AUDJPY 1-hour double top. On the 5-minute chart, a triple bottom around the neck line. Then a pullback after breaking the counter-trend line triggers a rally-sell signal. Price then declines, albeit slowly.
34
After breaking a key horizontal line, a rally-sell signal lights up. And a large drop follows.
35
As a premise, the daily trend is down. After breaking the wedge, a rally-sell signal lights up on the retracement and price drops significantly.
36
Earlier note on NZD/CAD wedge. On the 15-minute chart, the rally-sell signal lights up before breaking the wedge.
37
After breaking the ascending triangle, a rally-sell signal lights up on the retracement. And price falls.
38
Rally-sell signals light near historically watched horizontal lines. When the signal lights up, consider the possibility of a double top.
39
After breaking below a downtrend flag, a rally-sell signal lights up on the pullback. And price falls. Subsequently, another rally-sell signal lights up once more.
40
Price rises toward a weekly-resistance zone. Rally-sell signals light up twice.
Background:
Weekly resistance
In four hours, 1 hour, 30 minutes, and 15 minutes, the so-called RCI3 triple-top
41
Price rises toward the weekly resistance zone. The mBDSR (RCI two-line filter) rally-sell signals light up twice.
Background:
Weekly resistance
In four hours, 1 hour, 30 minutes, 15 minutes, the so-called RCI3 triple-top
42
Price falls toward a historically watched line. Dip-buy signal lights up to rise.
Background:
4-hour RCI9 near bottom
1-hour and 30-minute show a so-called RCI3 double bottom


Indicator that shines when combined with RCI【BODSOR・mBDSR】
https://www.gogojungle.co.jp/tools/indicators/11836
※ An indicator developed to improve entry accuracy when using three RCI lines for buy-the-dips or sell-the-rallies.
PDF files are attached in 150 items. Many of them are examples that, by logically linking higher and lower timeframes using three RCI lines, sequentially examine the状況 of multiple lower timeframes and ultimately arrive at signals for dip buys or rally sells on the lower timeframe (= mbDSR signals). It is: explanations include more than 550 charts used.
