

Indicator that shows its power when combined with RCI, MA, GMMA, etc. Example of signs observed from April 4 to April 8
Indicator that demonstrates power when combined with RCI【BODSOR・mBDSR】
https://www.gogojungle.co.jp/tools/indicators/11836
※ An indicator developed to improve entry accuracy when using three RCI lines for buy-the-dips or sell-the-rebounds
Bonus PDF files are included: 150 in total. Many of them are examples that break down the process of logically linking higher and lower timeframes using three RCI lines, sequentially considering multiple lower timeframes, and ultimately waiting for the timing to buy on dips or sell on rebounds in the lower timeframe (i.e., the mBDSR signal). They are described as. A total of 550+ charts are used.
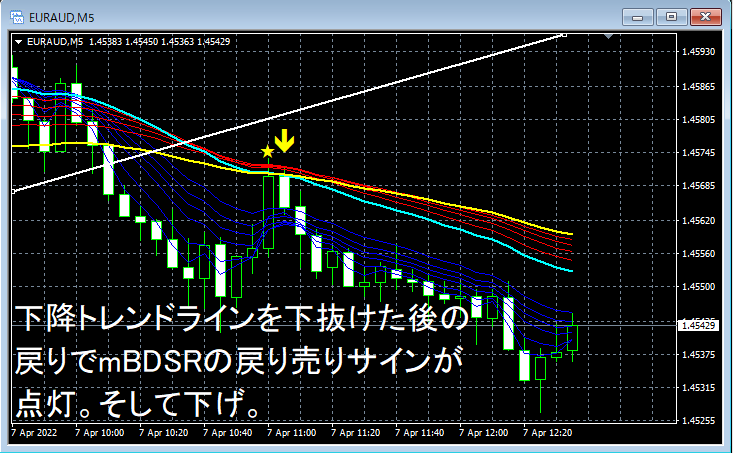
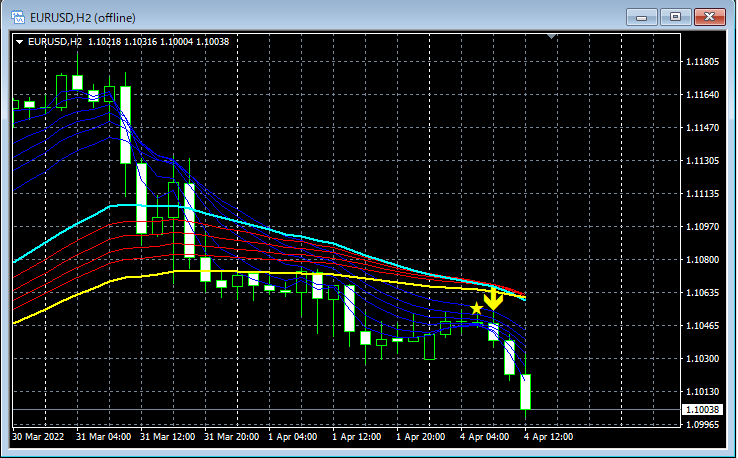
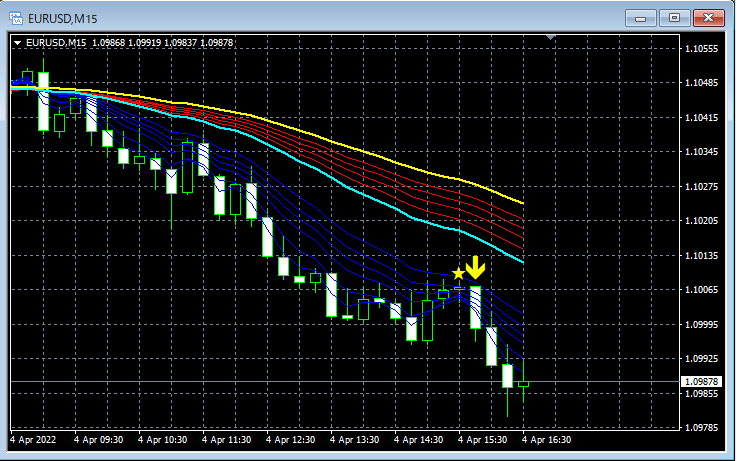
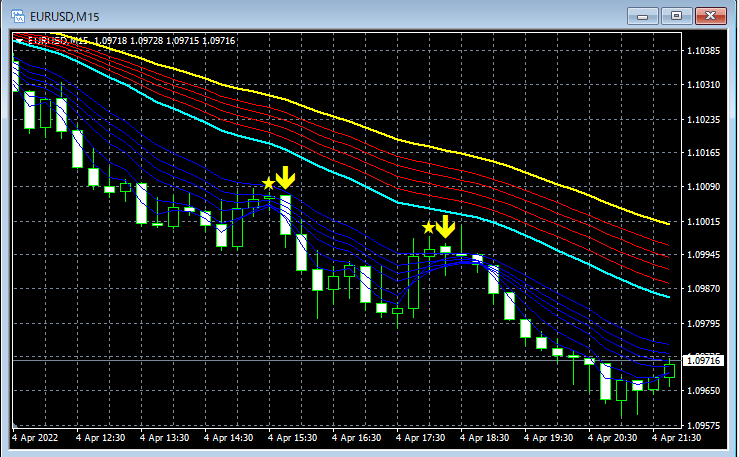
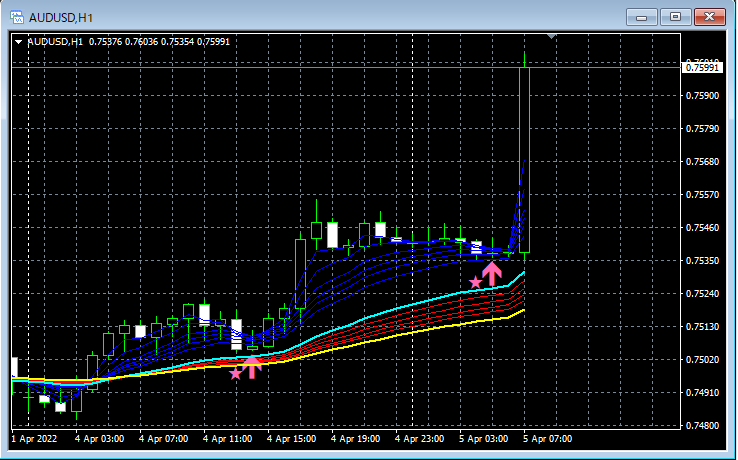
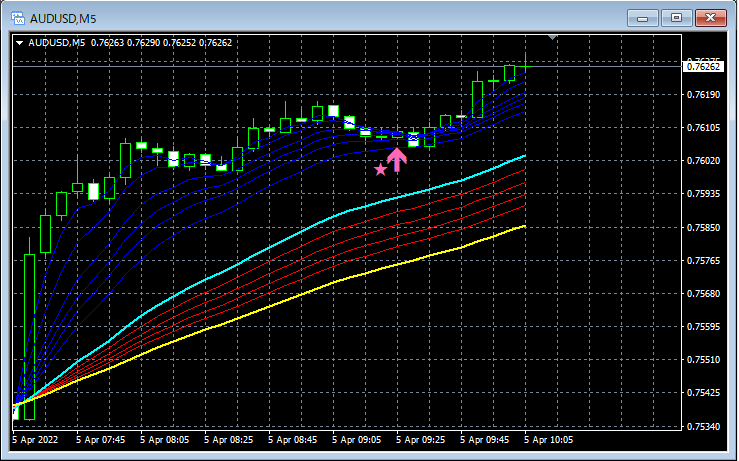
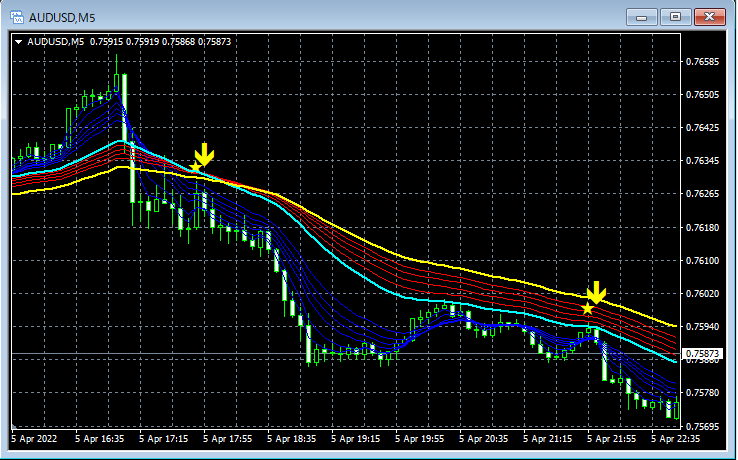
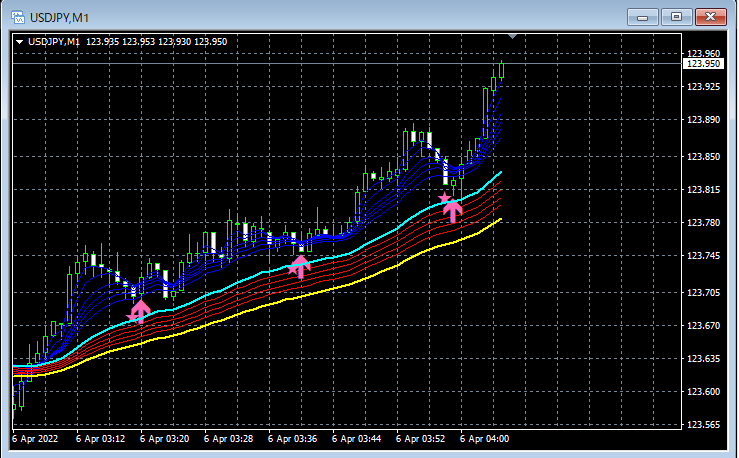
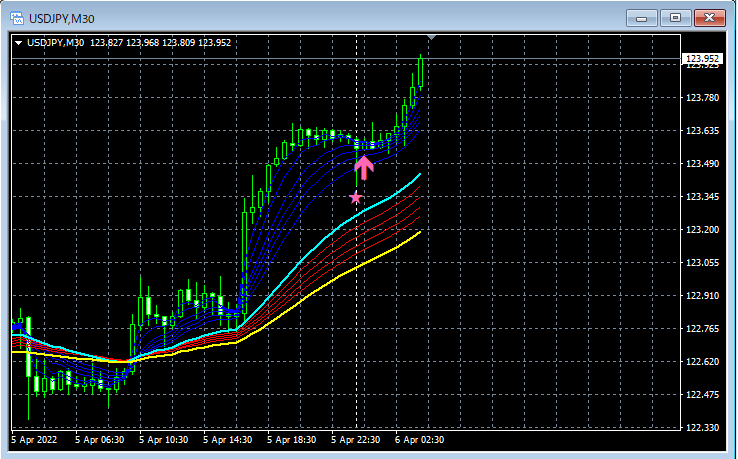
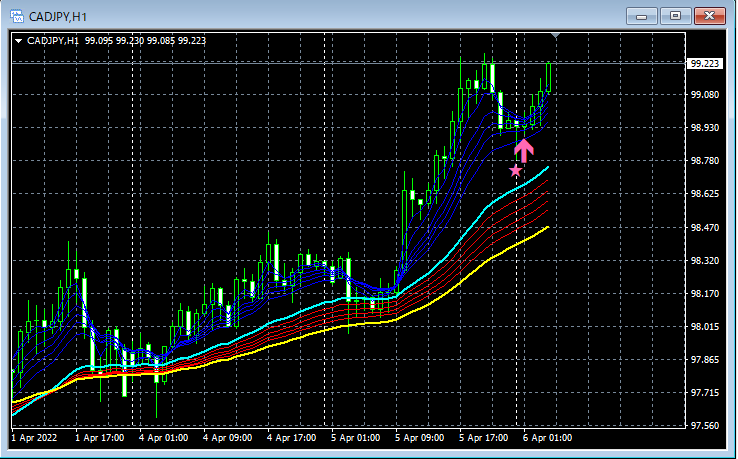
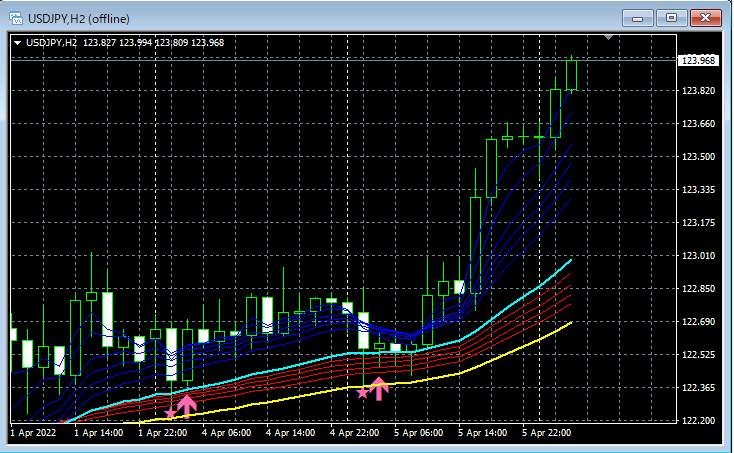
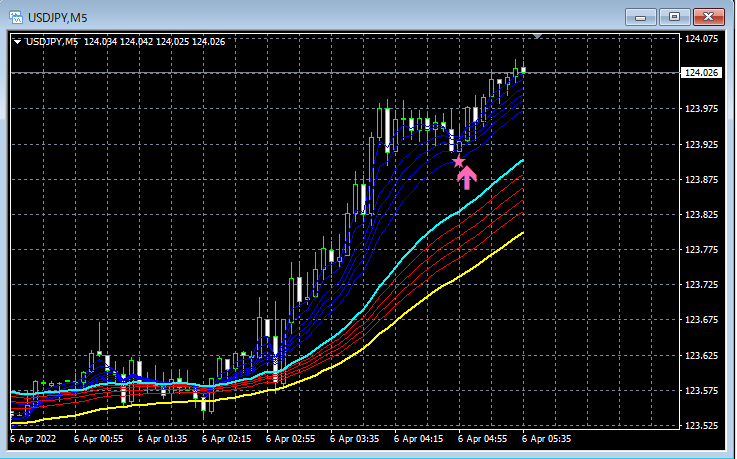
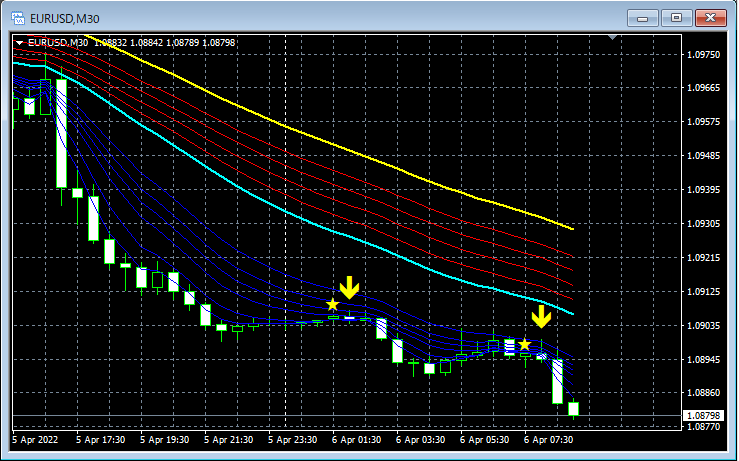
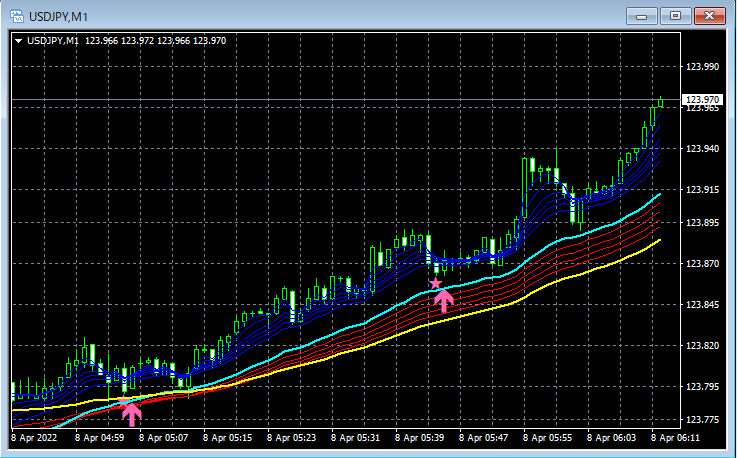
Below, from April 4 to April 8,examples where the mBDSR (moving average filter version) signal appears to have worked well are picked and introduced.Note that the charts below also displayGMMA included with this product.12345678910111213Indicator that demonstrates power when combined with RCI【BODSOR・mBDSR】https://www.gogojungle.co.jp/tools/indicators/11836※ An indicator developed to improve entry accuracy when using three RCI lines for buy-the-dips or sell-the-reboundsBonus PDF files are included: 150 in total.Many of them are examples that break down the process of logically linking higher and lower timeframes using three RCI lines, sequentially considering multiple lower timeframes, and ultimately waiting for the timing to buy on dips or sell on rebounds in the lower timeframe (i.e., the mBDSR signal).They are described as.A total of 550+ charts are used.
Note that the charts below also displayGMMA included with this product.
Indicator that demonstrates power when combined with RCI【BODSOR・mBDSR】
https://www.gogojungle.co.jp/tools/indicators/11836
※ An indicator developed to improve entry accuracy when using three RCI lines for buy-the-dips or sell-the-rebounds
Bonus PDF files are included: 150 in total. Many of them are examples that break down the process of logically linking higher and lower timeframes using three RCI lines, sequentially considering multiple lower timeframes, and ultimately waiting for the timing to buy on dips or sell on rebounds in the lower timeframe (i.e., the mBDSR signal). They are described as. A total of 550+ charts are used.
