

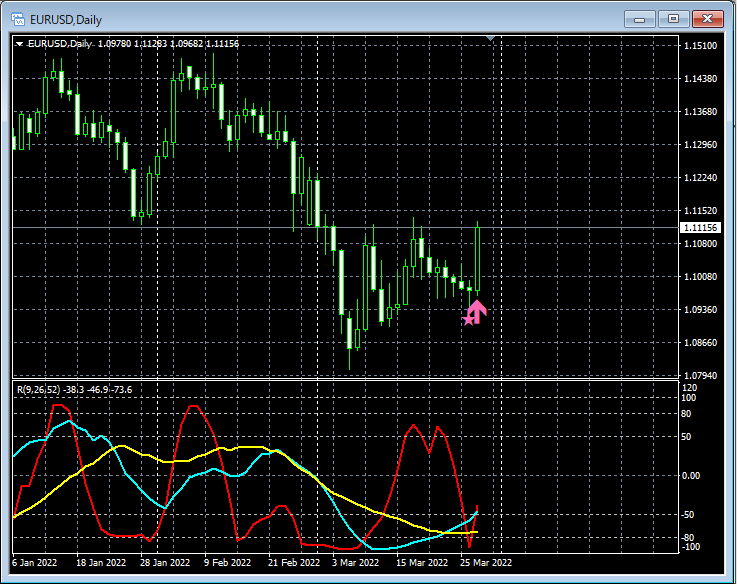
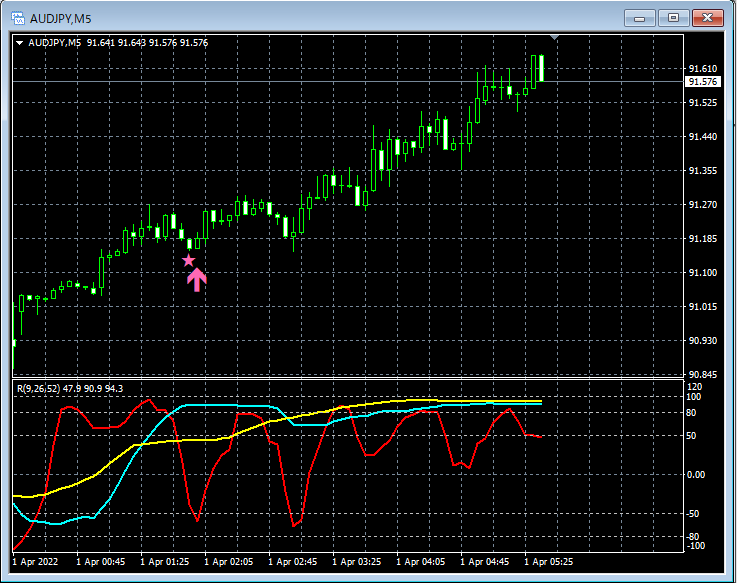
Targeting the timing before the three-line RCI3 alignment is achieved! (March 28 to April 1)
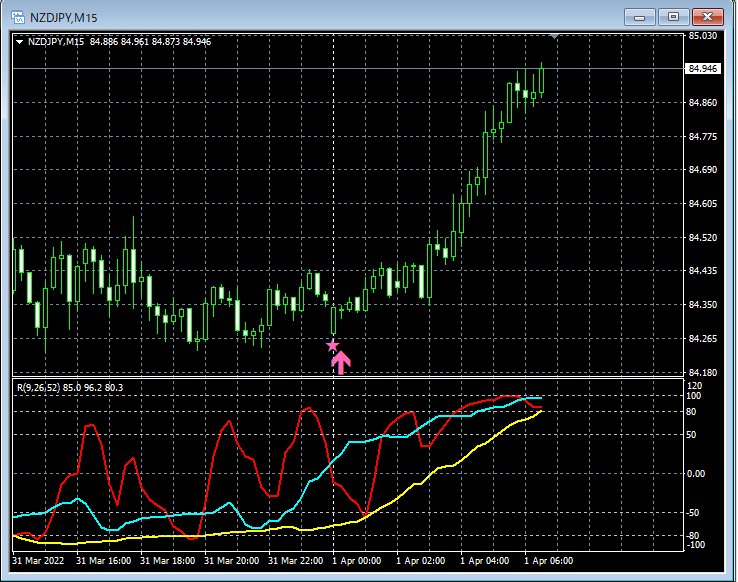
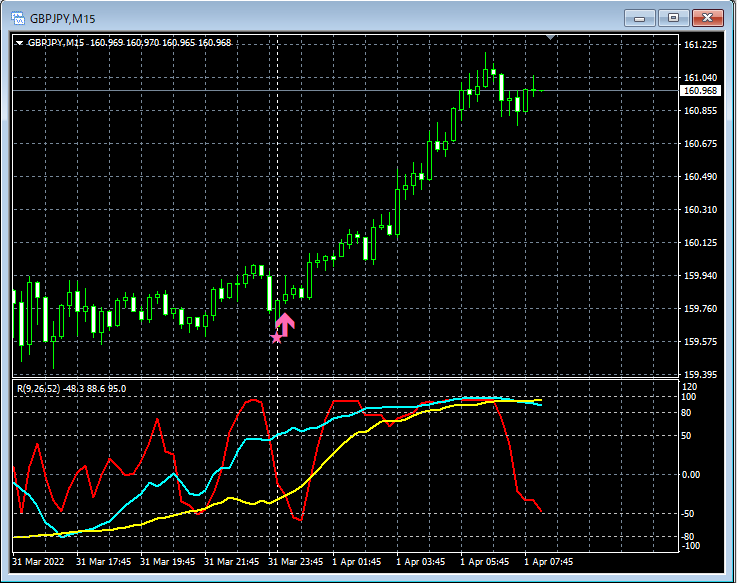
Indicator that shines in combination with RCI: BODSOR・mBDSR
https://www.gogojungle.co.jp/tools/indicators/11836
※ An indicator developed to improve entry accuracy when buying on pullbacks or selling on rallies using three RCI lines
PDF files are included: 150 items. Many of them are summaries of examples that derive a framework in which the higher and lower timeframes are logically linked using the three RCI lines, and ultimately wait for pullback buy or pullback sell timing on the lower timeframe (the mBDSR signal). Explanation uses more than 550 charts.
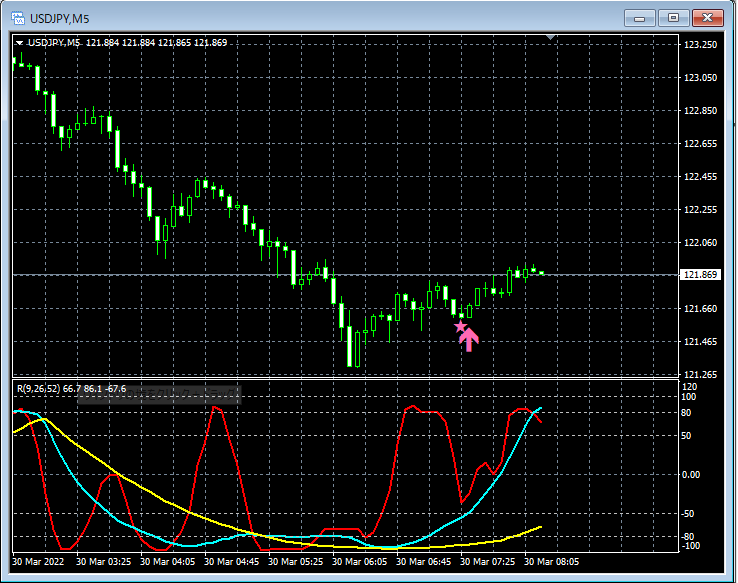
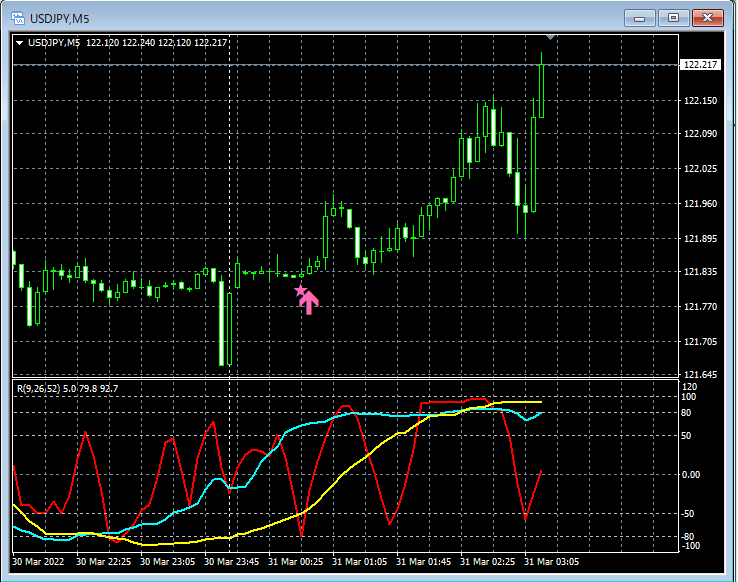
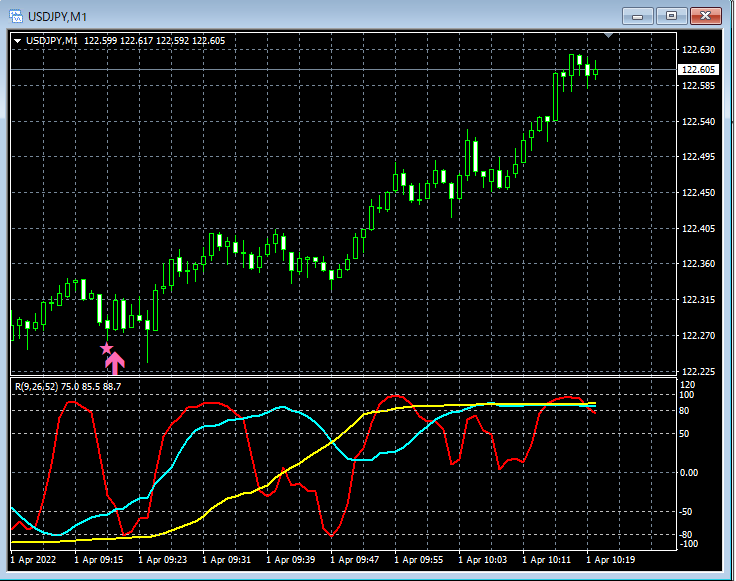
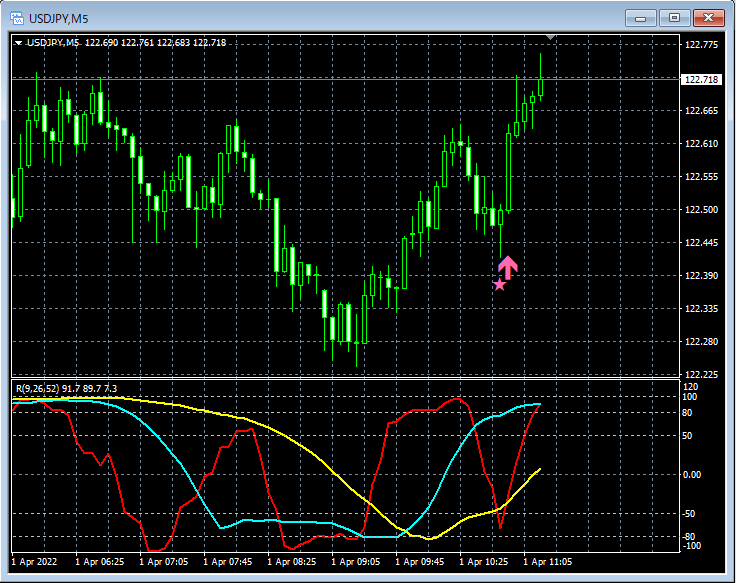
USD/JPY 5-minute chart
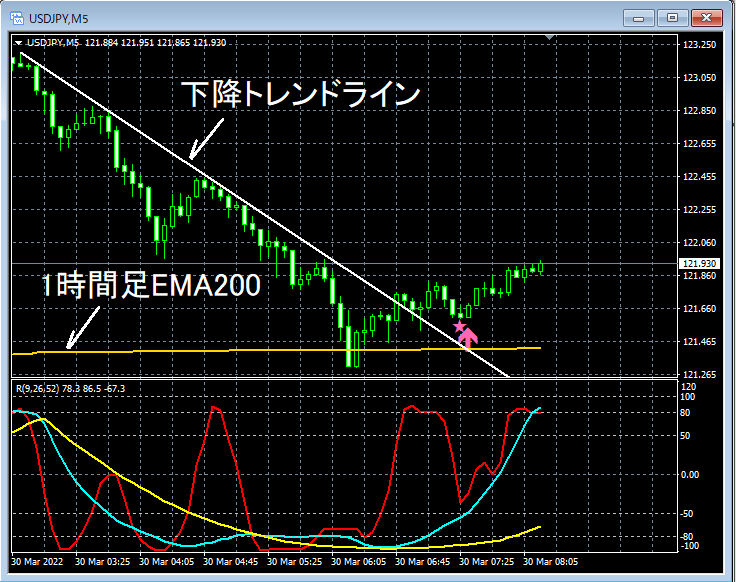
Rebound around the 1-hour EMA200
→ Break above the downtrend line
→ Rise after the pullback buy signal from mBDSR (RCI two-line filter)
Indicator that shines in combination with RCI: BODSOR・mBDSR
https://www.gogojungle.co.jp/tools/indicators/11836
※ An indicator developed to improve entry accuracy when buying on pullbacks or selling on rallies using three RCI lines
PDF files are included: 150 items. Many of them are summaries of examples that derive a framework in which the higher and lower timeframes are logically linked using the three RCI lines, and ultimately wait for pullback buy or pullback sell timing on the lower timeframe (the mBDSR signal). Explanation uses more than 550 charts.


