

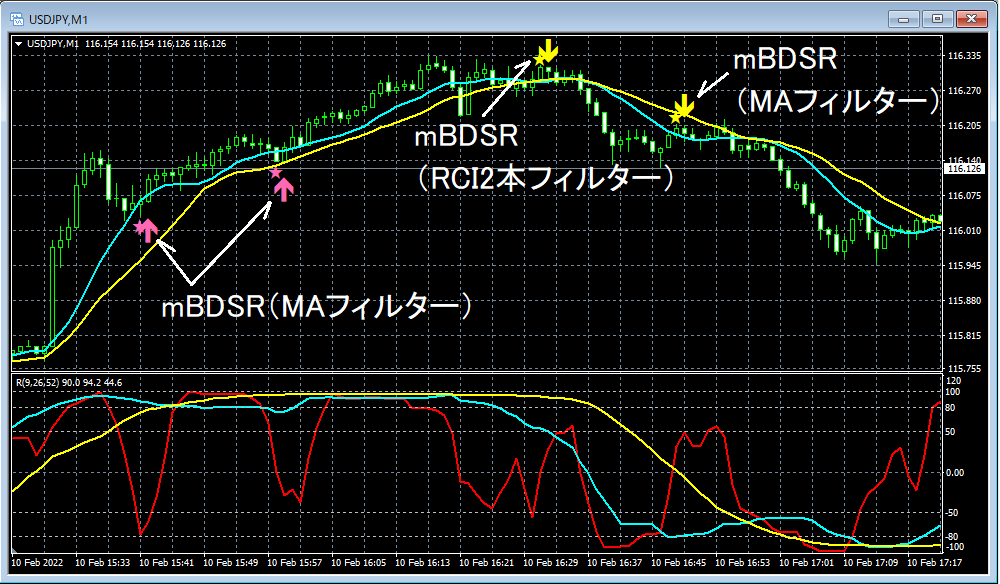
USD/JPY 1-minute chart after US CPI, RCI and MA and mBDSR [Chart Introduction]
Indicator that shines when used in combination with RCI: BODSOR・mBDSR
https://www.gogojungle.co.jp/tools/indicators/11836
*An indicator developed to improve entry accuracy when using three RCI lines for buying on dips and selling on rallies.
PDF files are attached as 150 items. Many of them are examples that break down the process of logically linking higher and lower timeframes using the three RCI lines, and finally waiting for a timing to buy on dips or sell on rallies on the lower timeframe (the mBDSR signal). summaries of examples that use more than 550 charts.
Below, we introduce the mBDSR signal on the 1-minute USD/JPY chart after the February 10 U.S. CPI release.mBDSR signal.
Indicator that shines when used in combination with RCI: BODSOR・mBDSR
https://www.gogojungle.co.jp/tools/indicators/11836
*An indicator developed to improve entry accuracy when using three RCI lines for buying on dips and selling on rallies.
PDF files are attached as 150 items. Many of them are examples that break down the process of logically linking higher and lower timeframes using the three RCI lines, and finally waiting for a timing to buy on dips or sell on rallies on the lower timeframe (the mBDSR signal). They are summaries of examples that use more than 550 charts.


