

Indicator that shines when combined with RCI, MA, GMMA, etc. Example signals observed from January 10 to January 14
An indicator that shows its power when combined with RCI【BODSOR・mBDSR】
https://www.gogojungle.co.jp/tools/indicators/11836
※ An indicator developed to improve entry accuracy when using three RCI lines for buying on pullbacks or selling on rallies
The bonus PDF file includes 150 items. Many of them are examples that summarize how, by logically linking higher and lower timeframes using three RCI lines, multiple lower-timeframe conditions are examined in sequence, ultimately waiting for pullback buying or pullback selling timing on the lower timeframe (i.e., the mBDSR signal). They are. The explanation uses more than 550 charts .
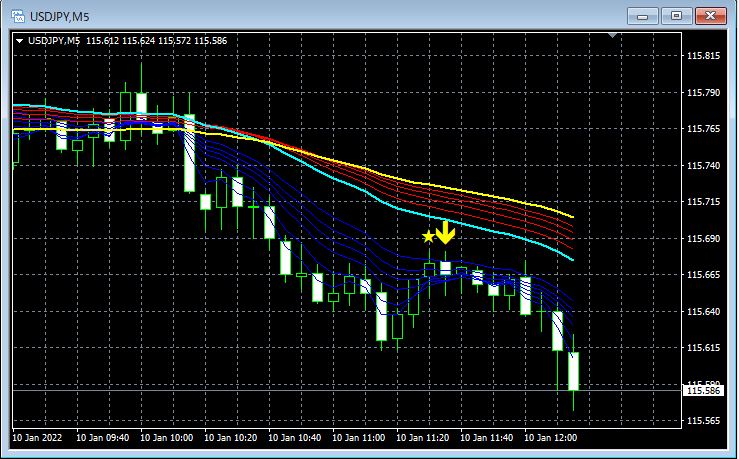
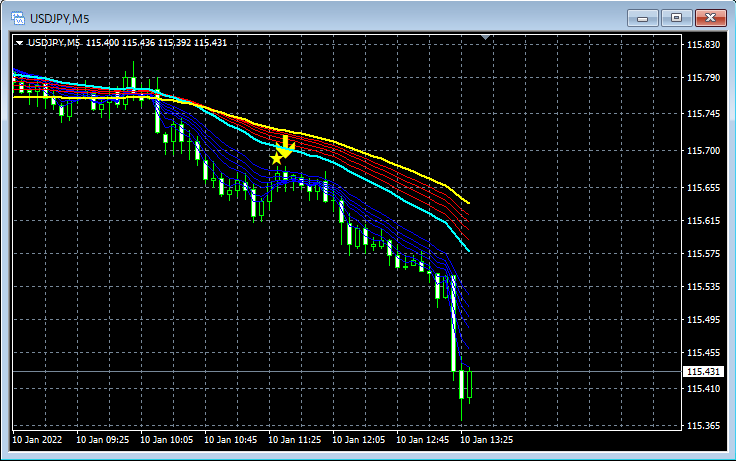
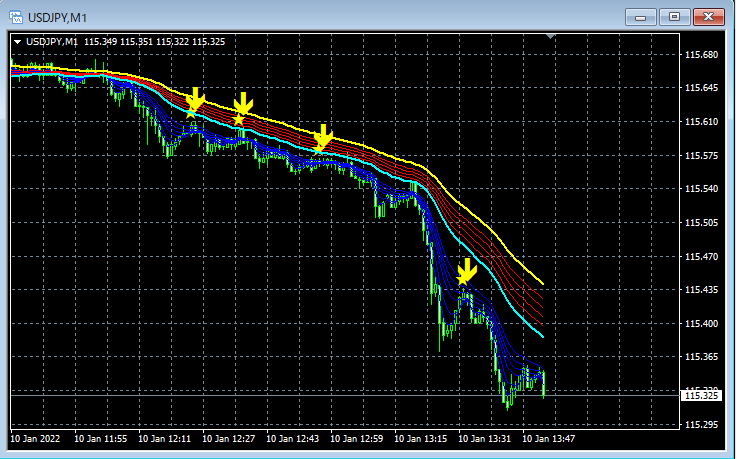
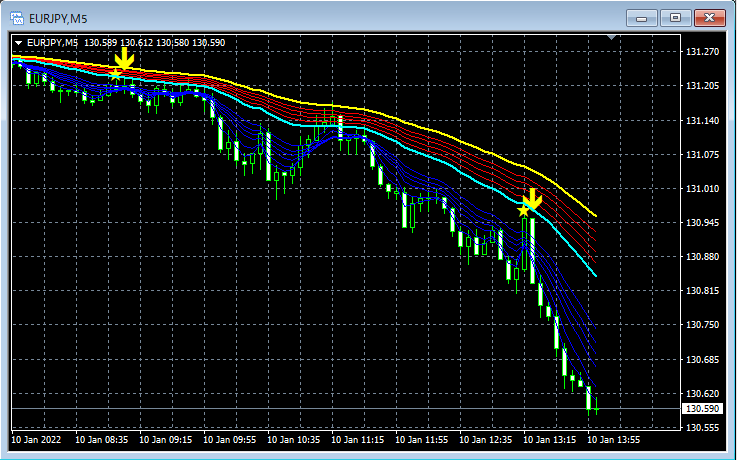
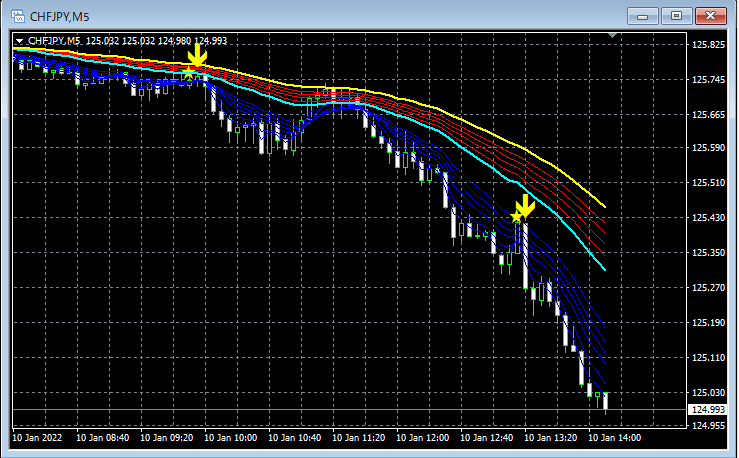
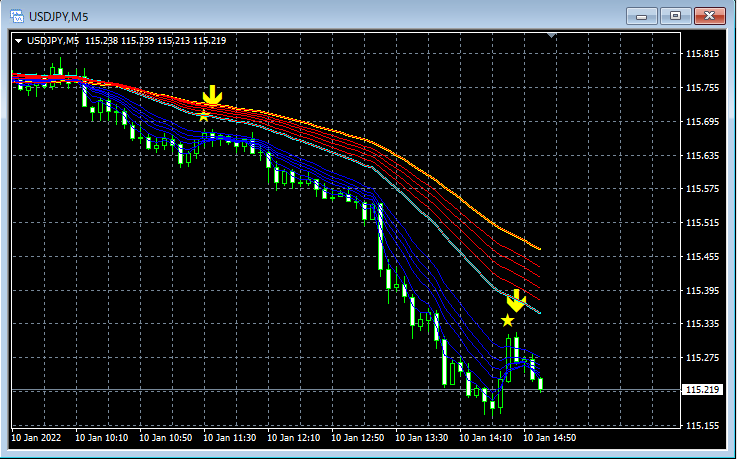
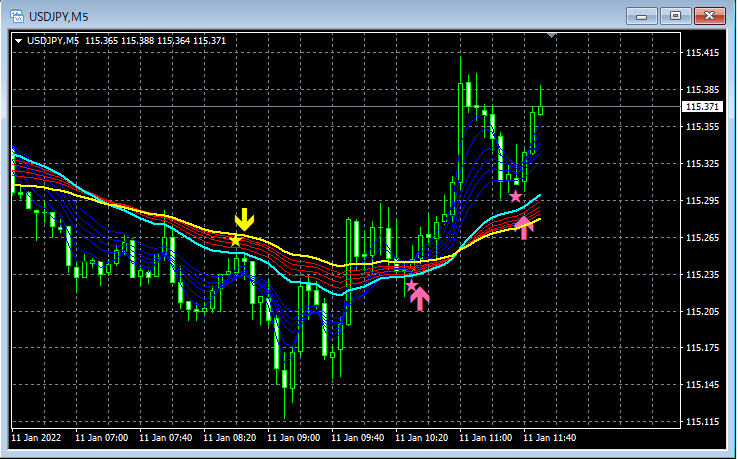
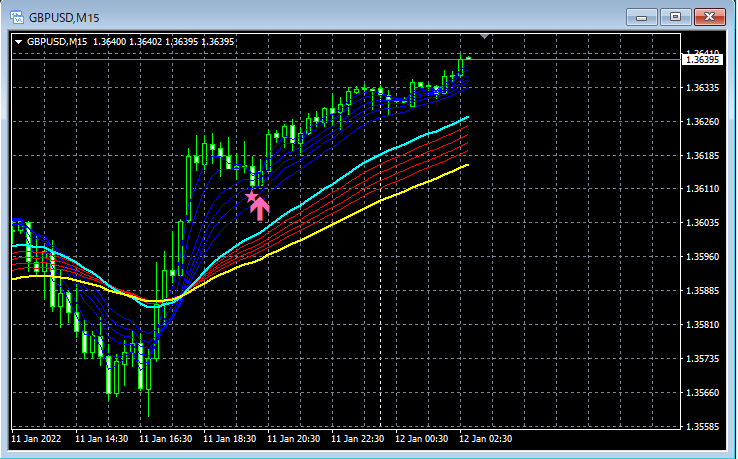
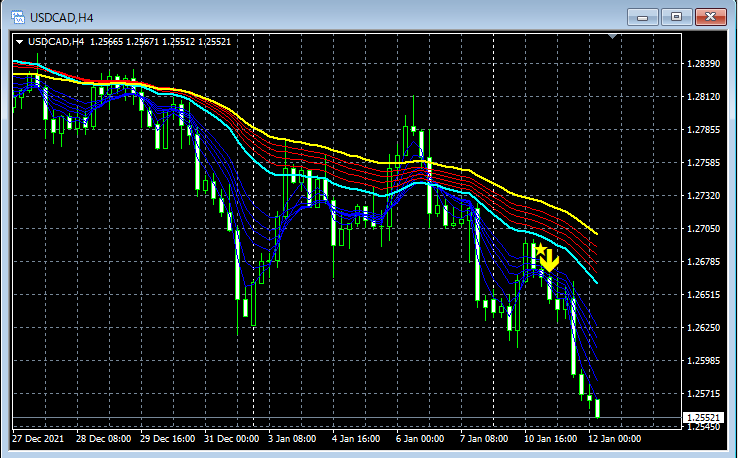
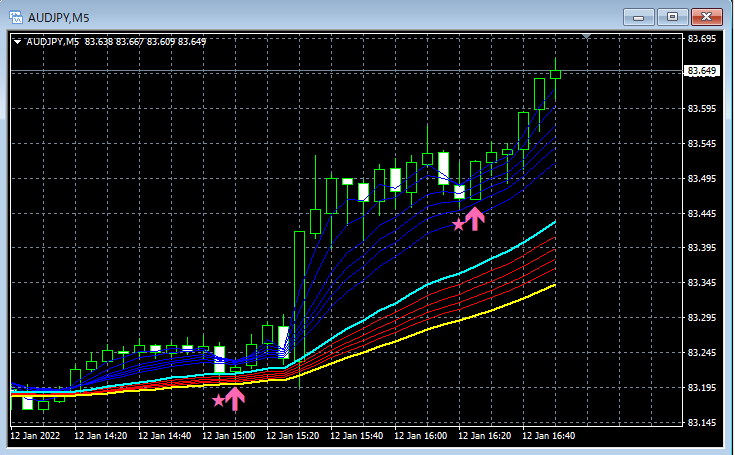
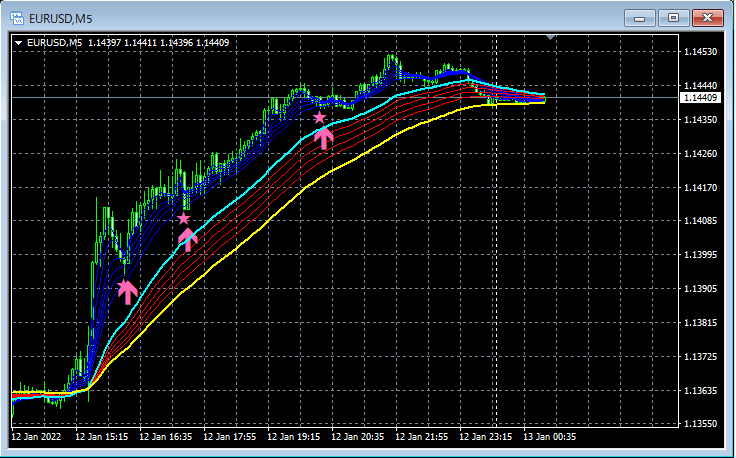
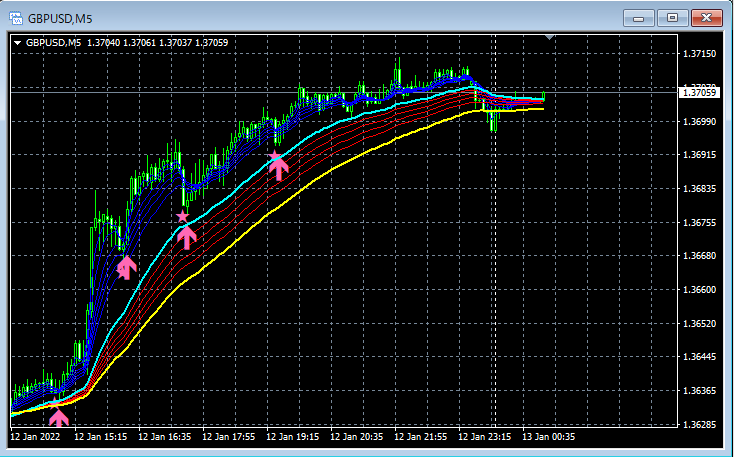
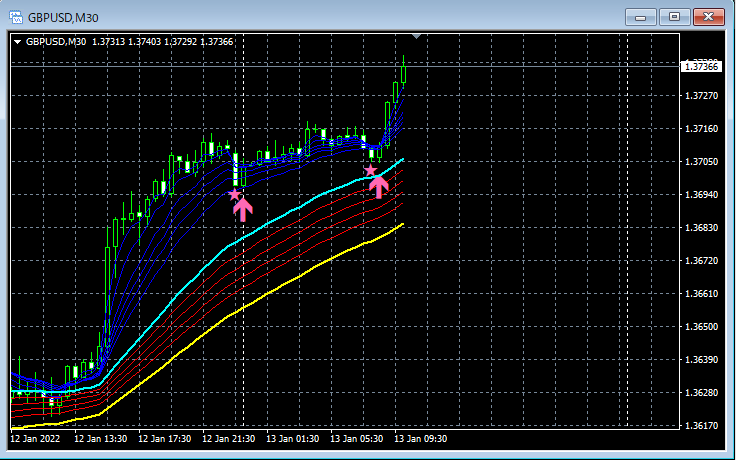
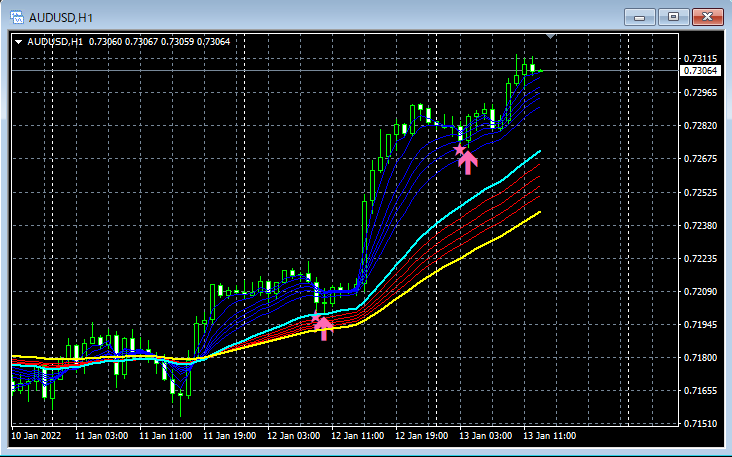
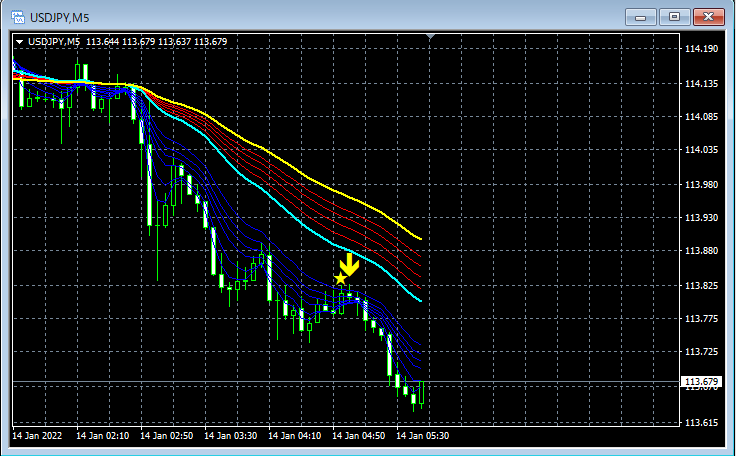
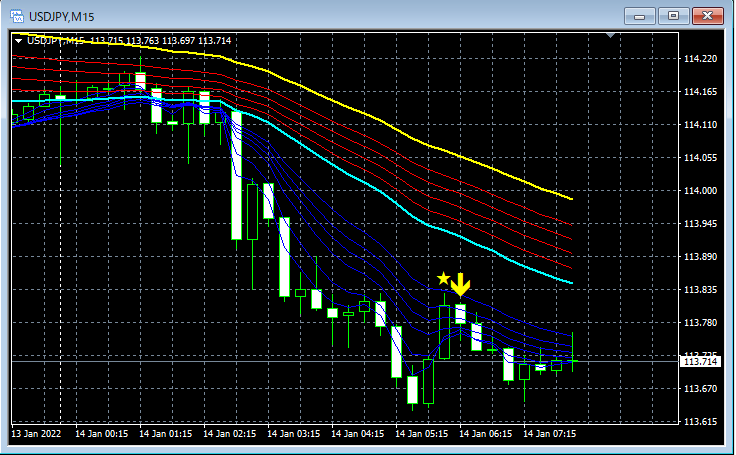
Below, from January 10 to January 14, we pick up and introduce some examples where the signals of mBDSR (moving-average-filter version) appear to have worked well.
Note that in the charts below, GMMA included with this product is also displayed.
An indicator that shows its power when combined with RCI【BODSOR・mBDSR】
https://www.gogojungle.co.jp/tools/indicators/11836
※ An indicator developed to improve entry accuracy when using three RCI lines for buying on pullbacks or selling on rallies
The bonus PDF file includes 150 items. Many of them are examples that summarize how, by logically linking higher and lower timeframes using three RCI lines, multiple lower-timeframe conditions are examined in sequence, ultimately waiting for pullback buying or pullback selling timing on the lower timeframe (i.e., the mBDSR signal). They are. The explanation uses more than 550 charts .


