

An indicator that shows power when used in combination with RCI, MA, GMMA, etc. Example of signals observed from December 20 to December 24
Indicator that shines when used in combination with RCI: BODSOR・mBDSR
https://www.gogojungle.co.jp/tools/indicators/11836
*An indicator developed to improve entry accuracy when using three RCI lines for trend-following buying on pullbacks or selling on pullbacks.
A bonus PDF file with 150 items is included. Many of them are examples that have been distilled into a form where, by logically linking higher and lower timeframes using three RCI lines, the conditions of multiple lower timeframes are sequentially considered, and ultimately the timing for pullback buying or pullback selling on the lower timeframe (the mBDSR signal) is waited for. This is what they consist of. The explanations use more than 550 charts .
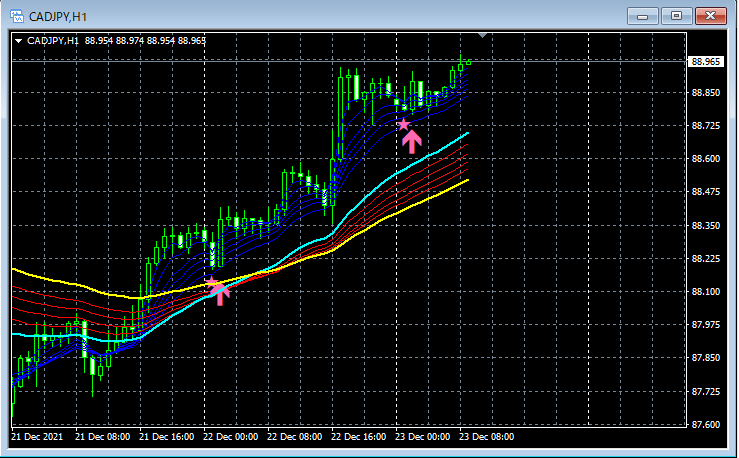
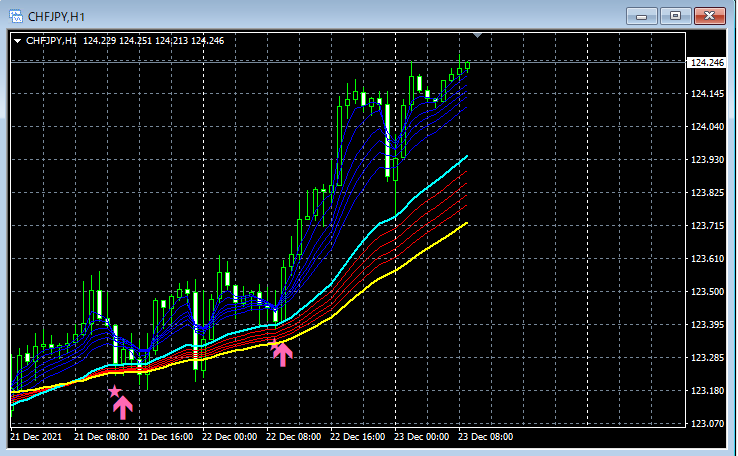
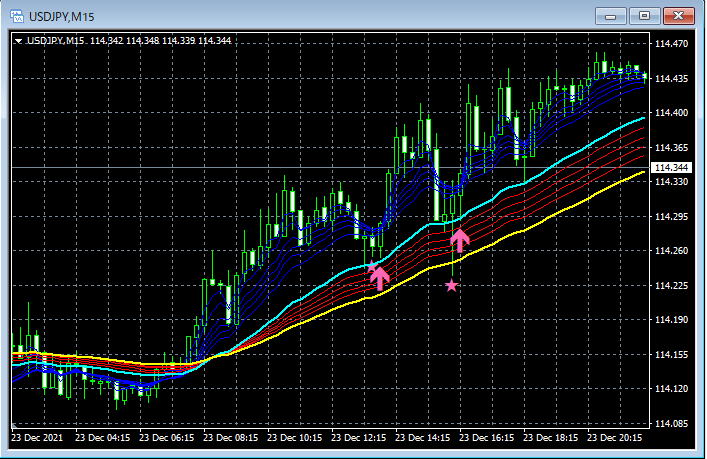
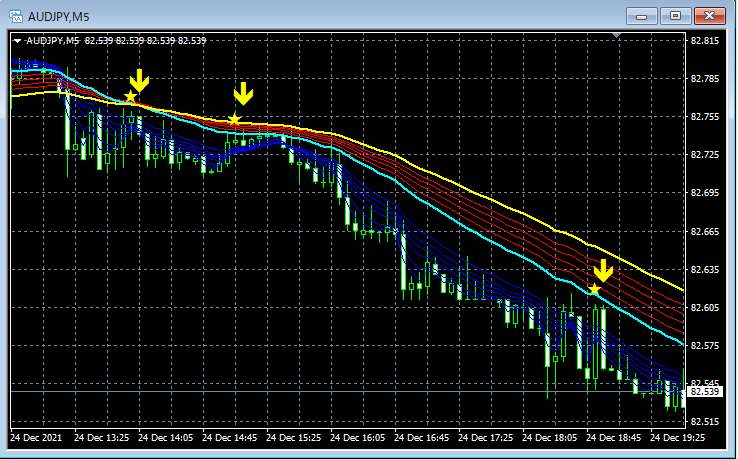
Below, from December 20 to December 24, we pick up and introduce examples where the signals of themBDSR (moving average filter version)appeared to function well.
In addition, the charts below also displayGMMAincluded with this product.


Indicator that shines when used in combination with RCI: BODSOR・mBDSR
https://www.gogojungle.co.jp/tools/indicators/11836
*An indicator developed to improve entry accuracy when using three RCI lines for trend-following buying on pullbacks or selling on pullbacks.
A bonus PDF file with 150 items is included. Many of them are examples that have been distilled into a form where, by logically linking higher and lower timeframes using three RCI lines, the conditions of multiple lower timeframes are sequentially considered, and ultimately the timing for pullback buying or pullback selling on the lower timeframe (the mBDSR signal) is waited for. This is what they consist of. The explanations use more than 550 charts .


