
Considerations on the rationale for buying 'RCI3 Three-Line + mBDSR' ~ An example of a pullback buy on the 1-hour chart
Note: This article is a transplanted blog post from July 7, 2020, to Investment Navigator + due to the GoGoJungle Blog ending.
Indicator that shines when used in combination with RCI: BODSOR and mBDSR
https://www.gogojungle.co.jp/tools/indicators/11836
An indicator developed to improve entry accuracy when using three RCI lines for pullbacks and retracements
Taking yesterday (July 6, 2020) for the Euro/Yen as an example,“Basis for a Buy”I would like to write a little about it.
The effective use of ‘RCI three lines + mBDSR’is considered very important.
EUR/JPY 4-hour chart
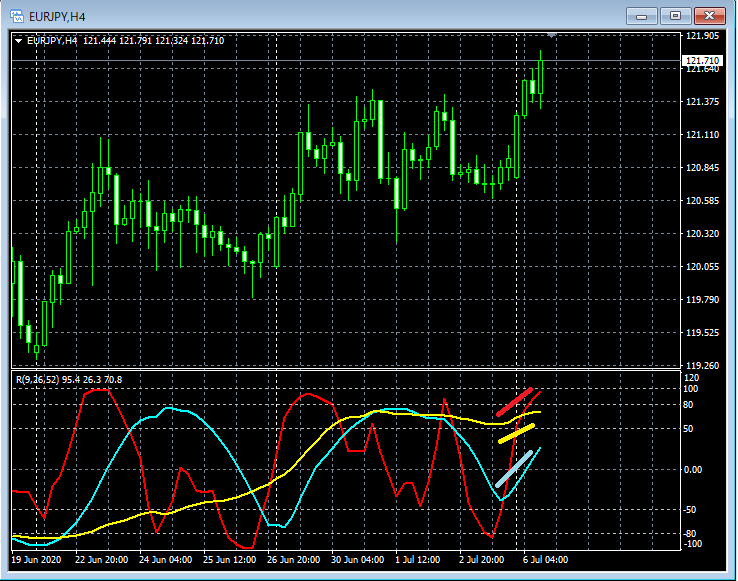
Lower panel: RCI three lines (RCI9, RCI26, RCI52)
Yesterday was Monday, but at market open at the start of the week, the three RCI lines were already aligned and rising, forming a very strong pattern.
Next, look at the lower time frame, the 1-hour chart.
EUR/JPY 1-hour chart
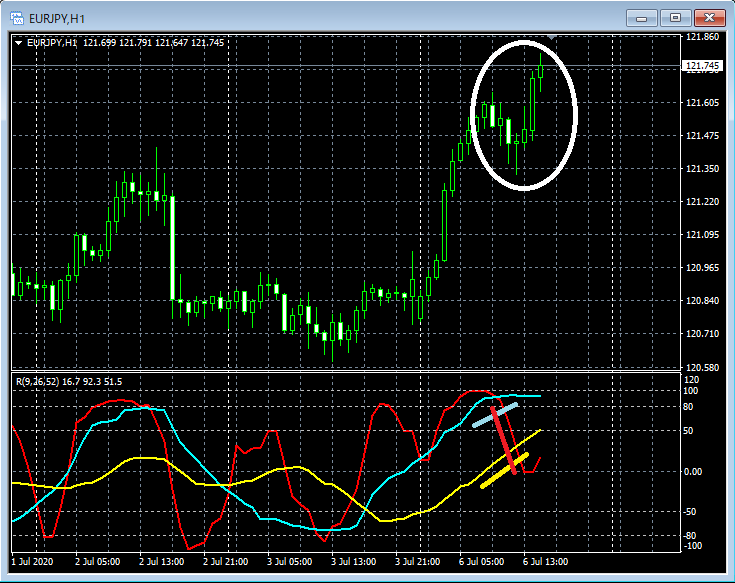
Lower panel: RCI three lines (RCI9, RCI26, RCI52)
On the 1-hour chart, only RCI9 among the three RCI lines clearly moved downward.
〇 The higher timeframe 4-hour chart remains in a very strong formation
〇 If RCI9 on the 1-hour chart reverses to rise, the three RCI lines could align again into a very strong rising pattern
Considering these two points, it might not be unusual to look for a pullback buy on the 1-hour chart.
Here, we will examine further on the lower time frame, the 5-minute chart, around the area circled in white on the above chart.
EUR/JPY 5-minute chart
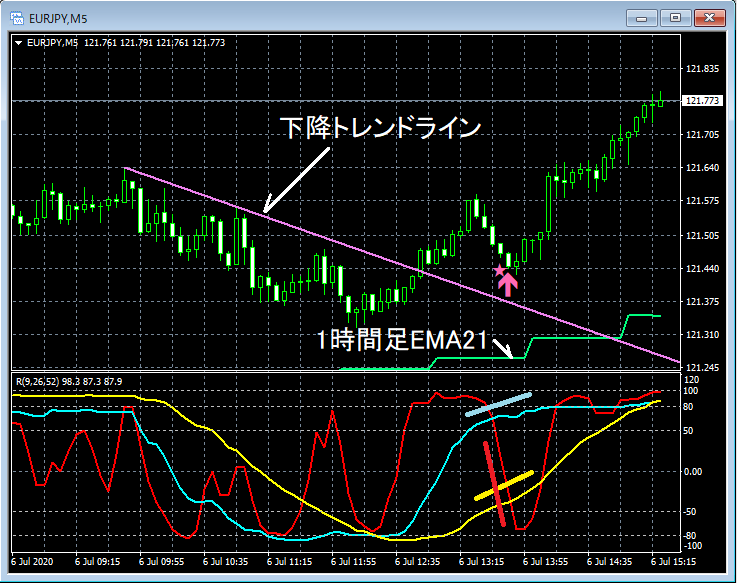
Upper: mBDSR signal (Filter: RCI26, RCI52), 1-hour EMA21, downtrend line
Lower: RCI three lines (RCI9, RCI26, RCI52)
On the 5-minute chart, price has not fallen to the 1-hour EMA21, but after breaking above the downtrend line,the mBDSR pullback-buy signal lights up. And although the price is bearish immediately after the pullback buy signal lights up, it subsequently rises steadily.
In this case...
〇 The 4-hour chart is forming a very strong pattern
〇 It is not strange to target a pullback buy on the 1-hour chart
〇 The price has broken above the downtrend line on the 5-minute chart
With these overlapping conditions, simplythe mBDSR pullback buy signal being lit up would not alone justify a buy; rather,the “basis for a buy” is likely to be multiple overlapping signals.
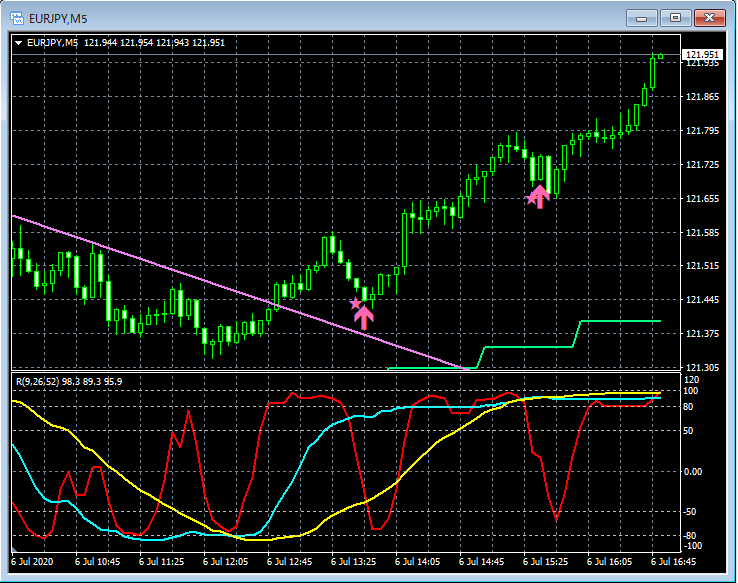
For reference, after this, on the lower chart, the 5-minute time frame againlights up the mBDSR pullback buy signal and price continues to rise.
EUR/JPY 5-minute chart

Upper: mBDSR signal (Filter: RCI26, RCI52), 1-hour EMA21, downtrend line
Lower: RCI three lines (RCI9, RCI26, RCI52)
This indicator has been on the market for more than three years, but so farthe useful application of ‘RCI three lines + mBDSR’is occasionally summarized in a bonus PDF as a参考. As of the date of this post (July 7, 2020), the number of bonus PDFs stands at nine.
Note: In the charts introduced in this article, for convenience of explanation, circles, lines, and rectangles may be added.
Indicator that shines when used in combination with RCI: BODSOR and mBDSR
https://www.gogojungle.co.jp/tools/indicators/11836
Note: An indicator developed to improve entry accuracy when using three RCI lines for pullbacks and retracements