

Continue down from the higher timeframe to the lower timeframe in three-line RCI, and wait for the mBDSR signal
Indicator that shines in combination with RCI: BODSOR・mBDSR
https://www.gogojungle.co.jp/tools/indicators/11836
※ An indicator developed to improve entry accuracy when buying on dips or selling on rallies using three RCI lines
Bonus PDF files are included: 150 files. Many of them are examples that use the RCI three-line method to logically link higher and lower timeframes, sequentially examine the conditions of multiple lower timeframes, and finally wait for the timing to buy on dips or sell on rallies in the lower timeframe (the mBDSR signal). They are. The explanation uses more than 550 charts .
Below is an example of an mBDSR signal observed this week. It also briefly explains the downflow from higher to lower timeframes using the RCI three-line method.
1. RCI three-line on the 4-month chart
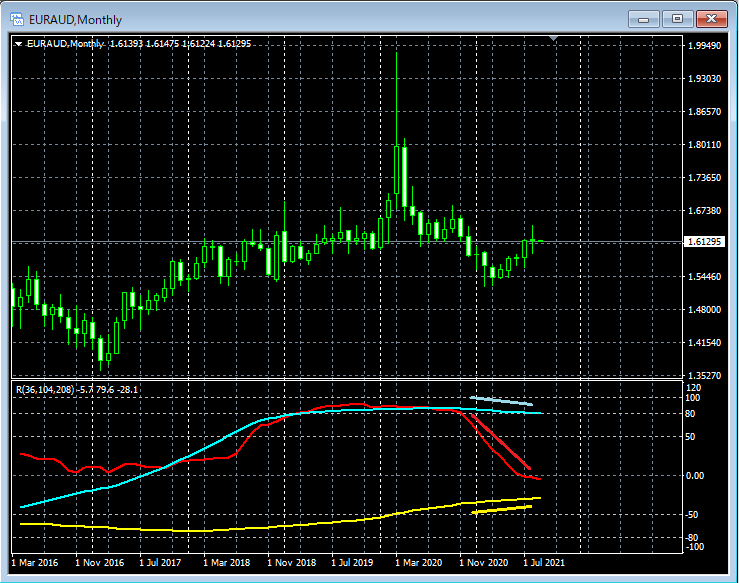
The RCI three-line on the 4-month chart (RCI9, RCI26, RCI52) can be substituted with the RCI36, RCI104, and RCI208 of the monthly chart.
Looking at the chart above, the monthly RCI36 and RCI104 are trending down, and the 4-month RCI9 and RCI26 may also be turning downward. The 4-month RCI three-line shape could be considered a weak formation.
2. RCI three-line on the monthly chart
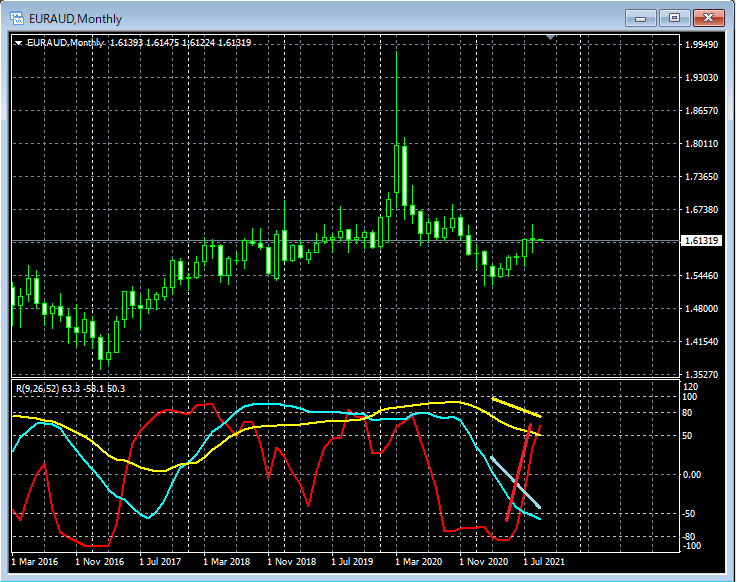
On the monthly RCI three-line, only RCI9 is rising. Considering that the 4-month RCI three-line may be in a weak shape, the monthly chart could be seeing a retracement setup. In other words, a setup where the retracement might be sold into.
If RCI9 turns downward here, all three RCI lines could form a very weak downtrend.
3. RCI three-line on the weekly chart
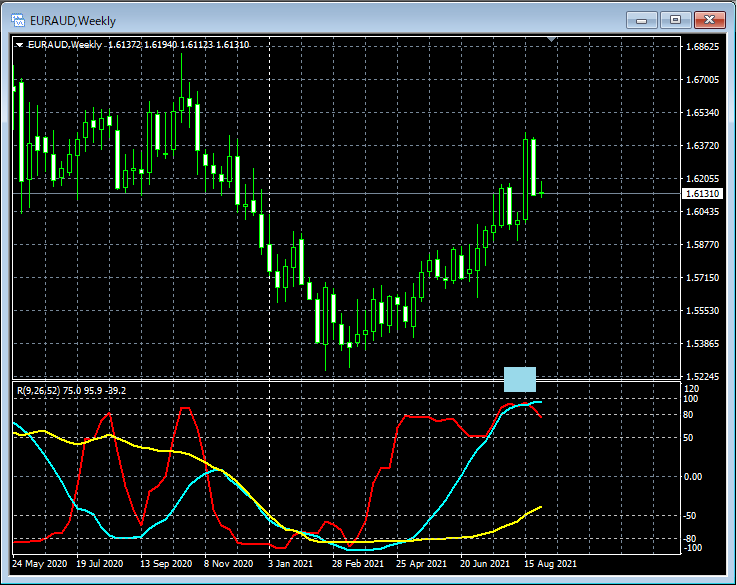
On the weekly RCI three-line, RCI9 and RCI26 are above (the so-called double top of RCI). There may be a slight pullback soon. Considering the monthly and 4-month conditions, this pullback could lead to a monthly-level retracement sale.
4. RCI three-line on the daily chart
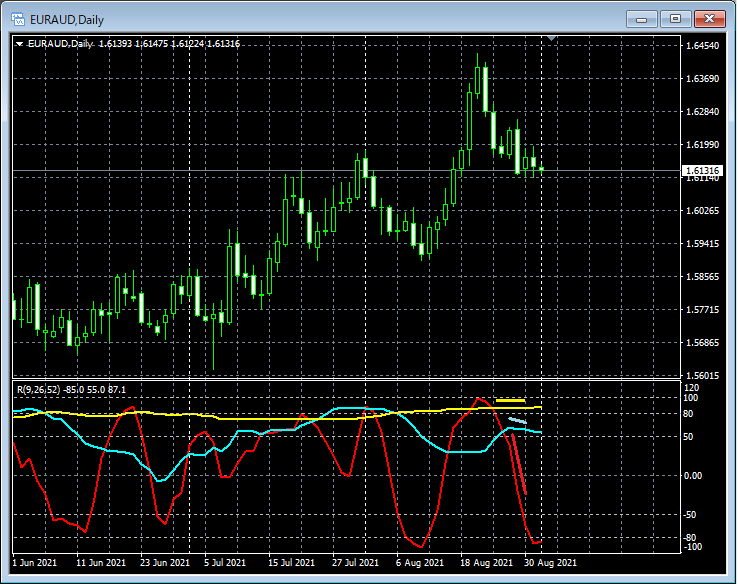
On the daily RCI three-line, RCI9 and RCI26 are declining, and the three-line shape may be considered weak. Therefore, a setup aiming for a retrace on lower timeframes could be plausible.
5. RCI three-line on the 4-hour chart and mBDSR (RCI two-line filter) retracement sell signal
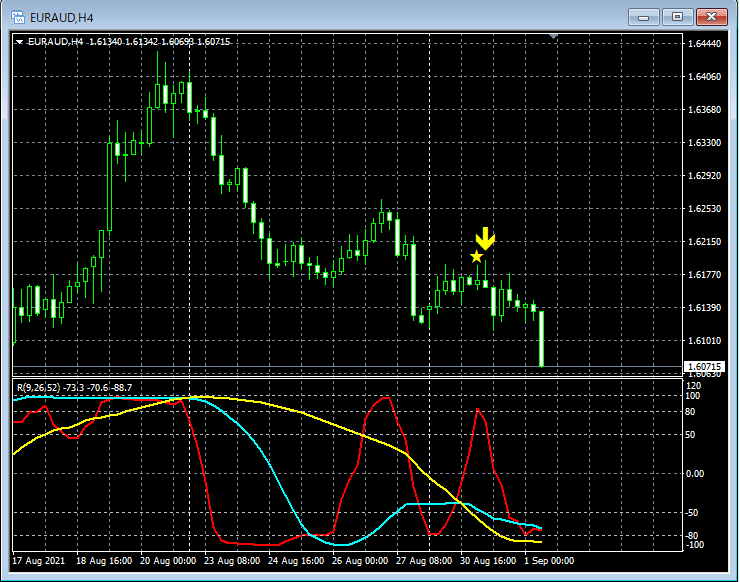
In such a situation, the 4-hour chart shows a strong decline after the mBDSR (RCI two-line filter) retracement sell signal lights up.
Indicator that shines in combination with RCI: BODSOR・mBDSR
https://www.gogojungle.co.jp/tools/indicators/11836
※ An indicator developed to improve entry accuracy when buying on dips or selling on rallies using three RCI lines
Bonus PDF files are included: 150 files. Many of them are examples that use the RCI three-line method to logically link higher and lower timeframes, sequentially examine the conditions of multiple lower timeframes, and finally wait for the timing to buy on dips or sell on rallies in the lower timeframe (the mBDSR signal). They are. The explanation uses more than 550 charts .


