

Indicator that shows strength when combined with the RCI3 single line; examples of signs observed from July 26 to July 30
Indicator that shines when combined with RCI:【BODSOR・mBDSR】
https://www.gogojungle.co.jp/tools/indicators/11836
*An indicator developed to improve entry accuracy when using three RCI lines for buying on pullbacks or selling on rallies.
A bonus PDF file with 150 items is included. Many of them are examples that break down the process into waiting for pullback buy or pullback sell timing (the mBDSR signal) on the lower timeframes by logically linking the higher and lower timeframes using the three RCI lines, and then examining multiple sub-timeframes sequentially. The descriptions use more than 550 charts .
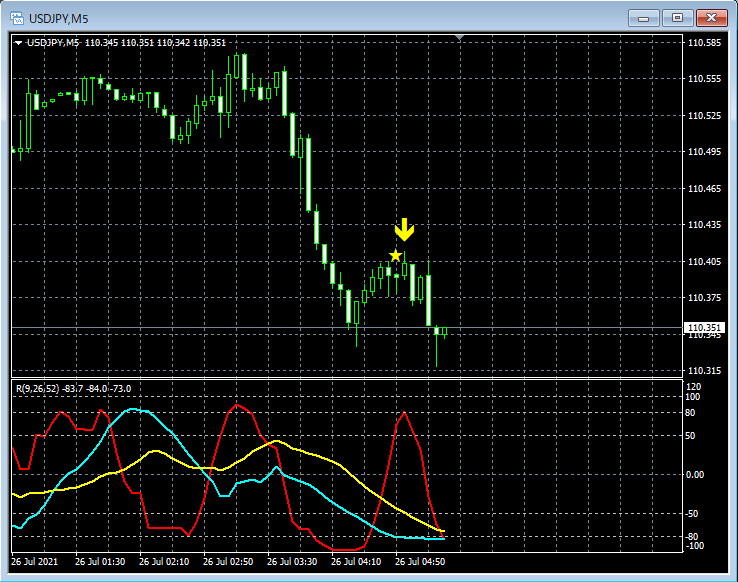
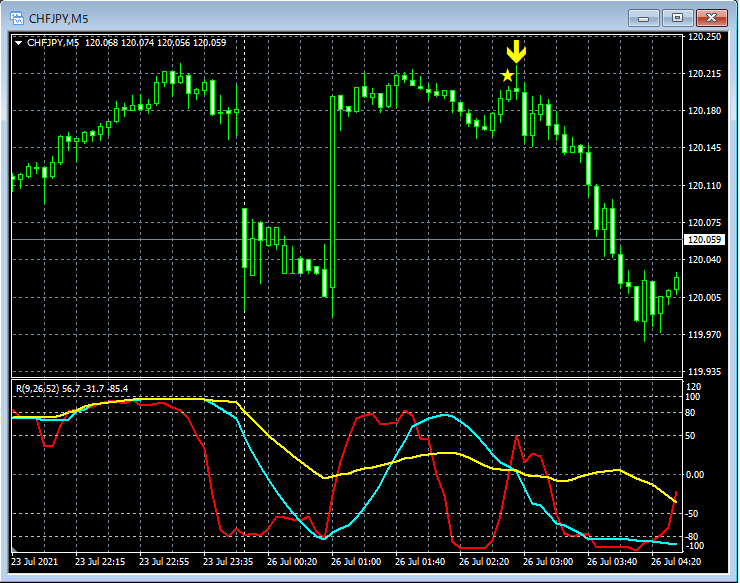
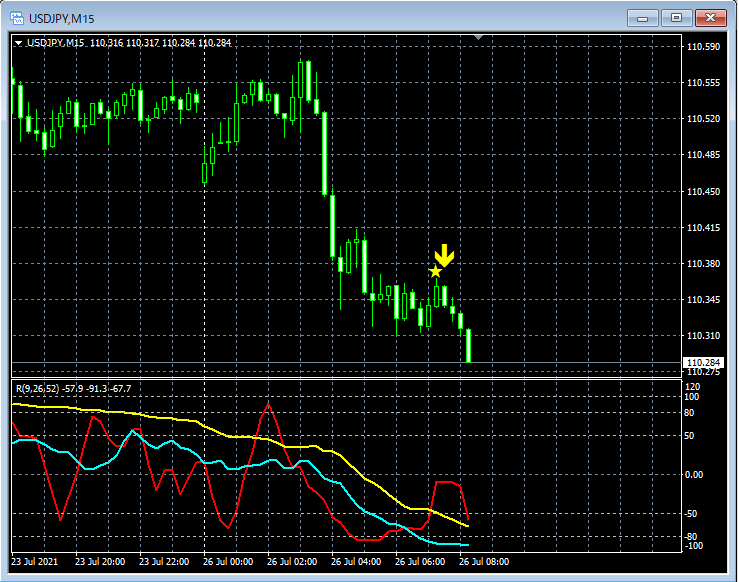
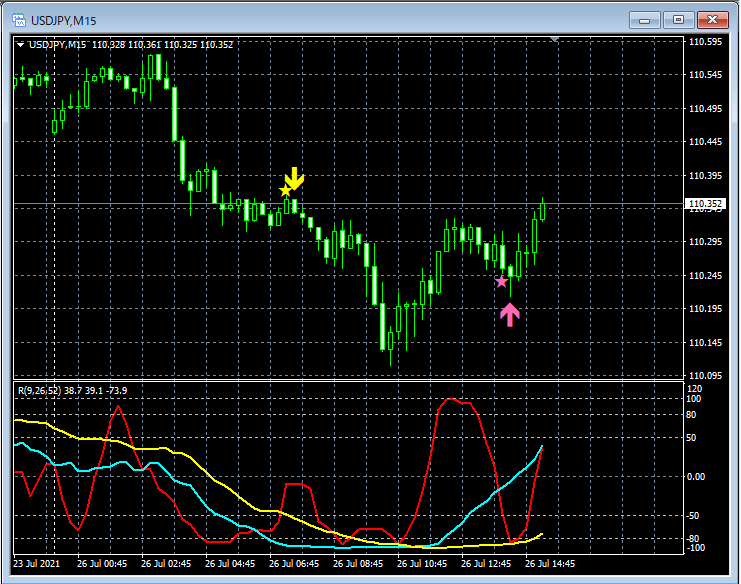
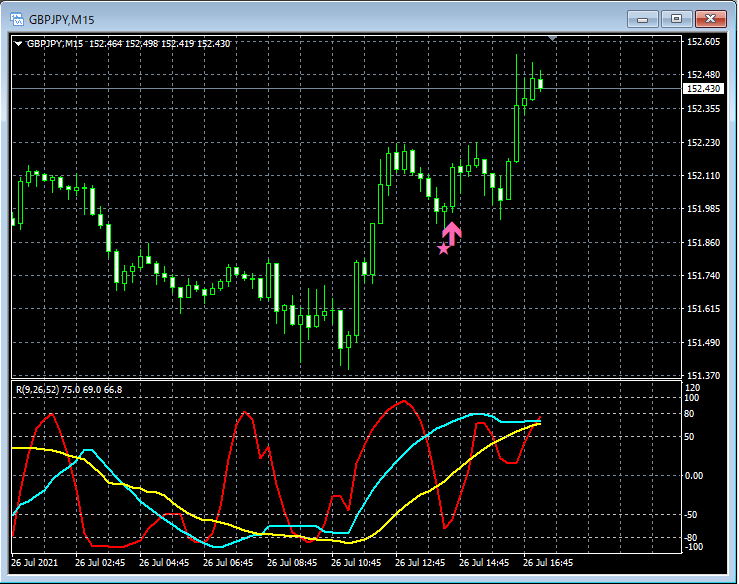
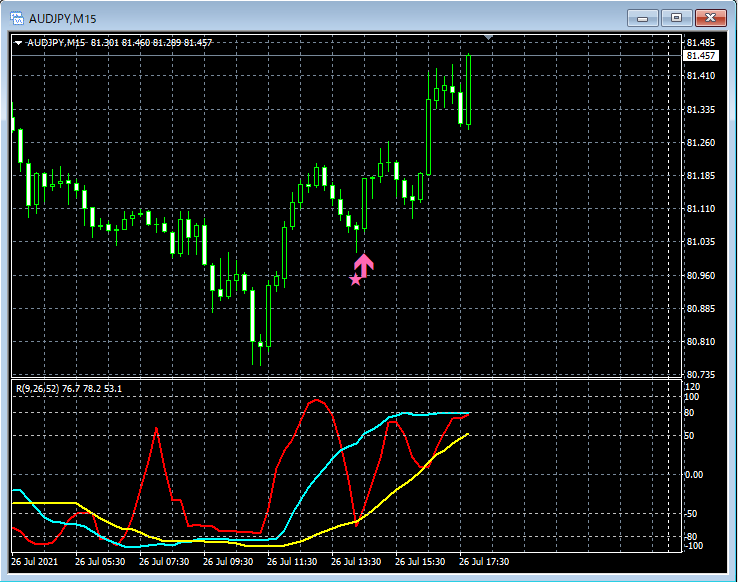
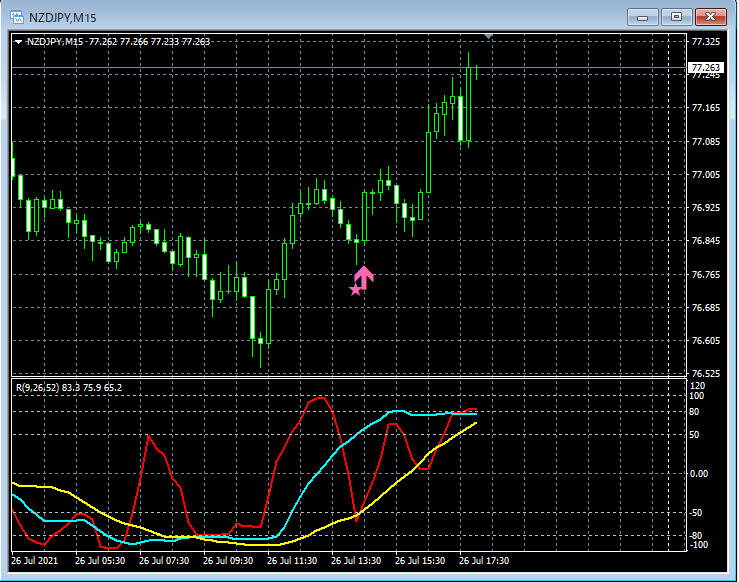
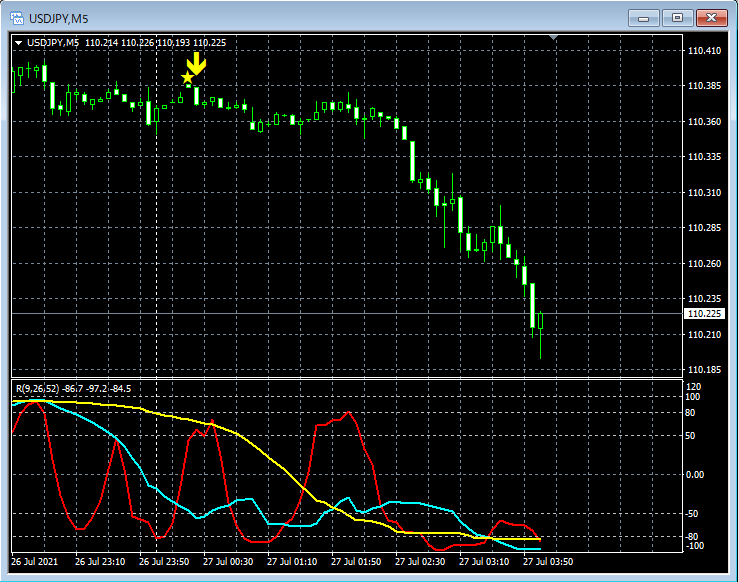
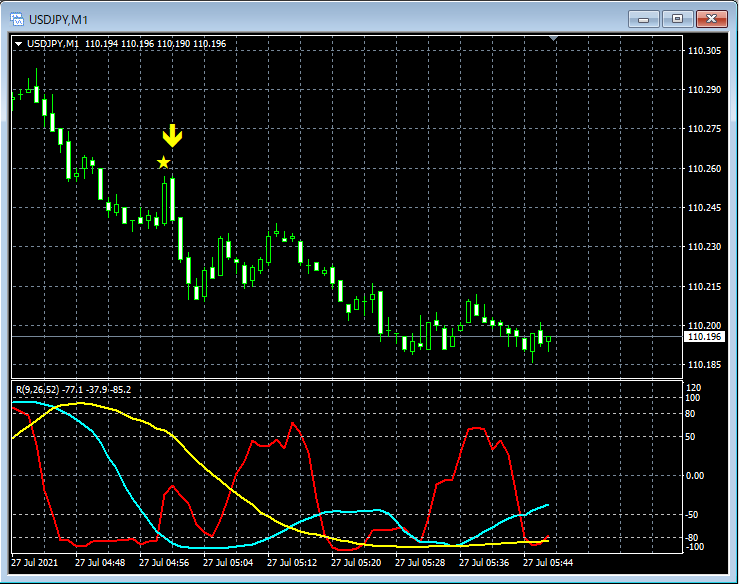
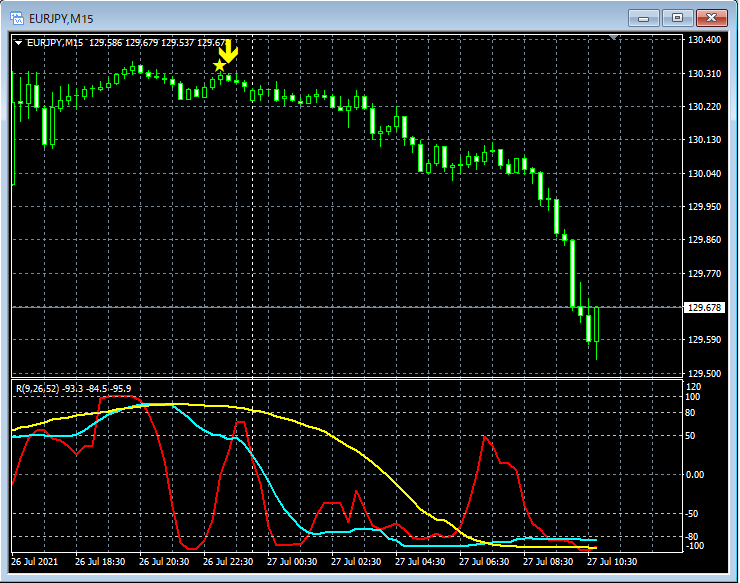
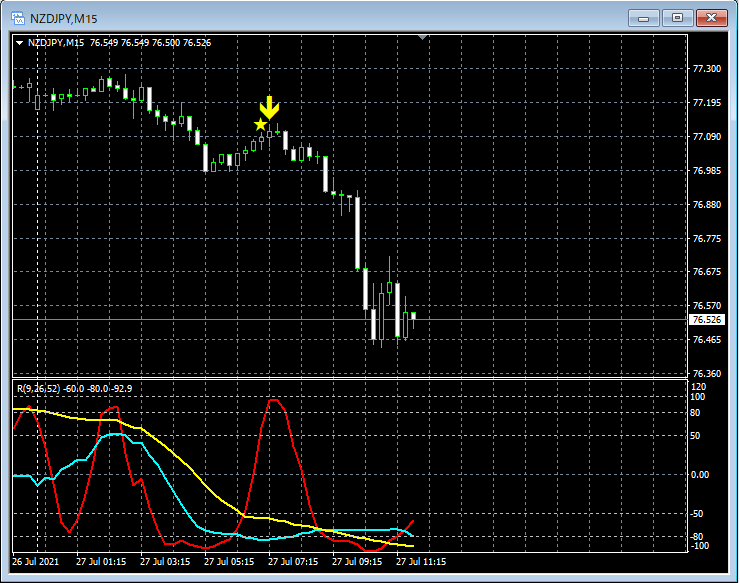
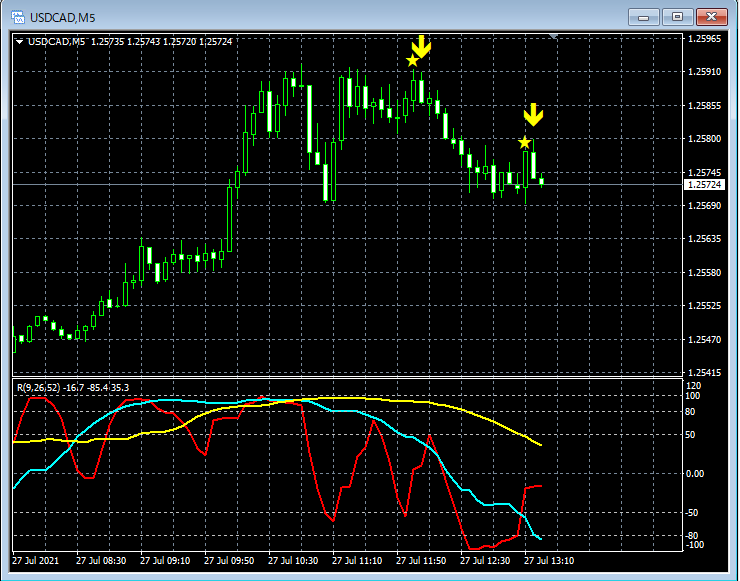
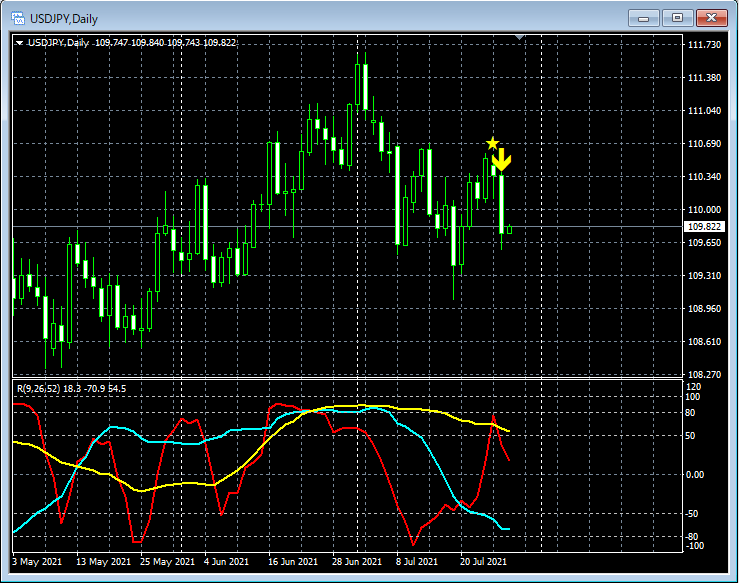
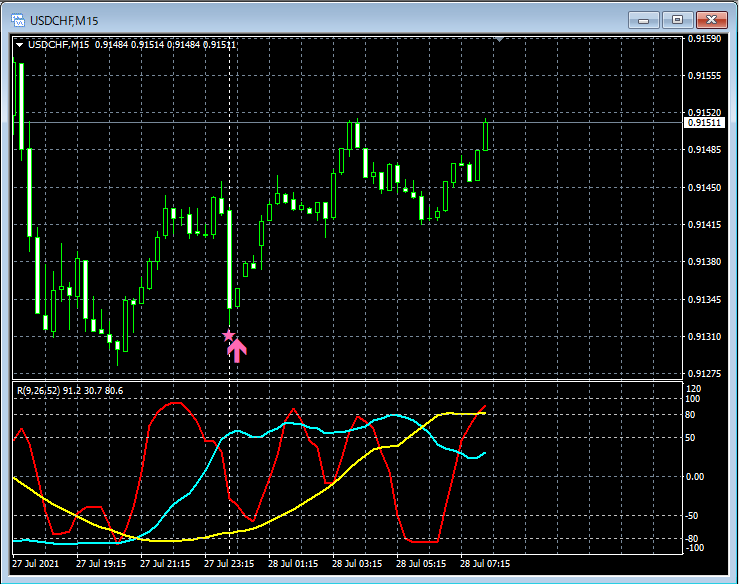
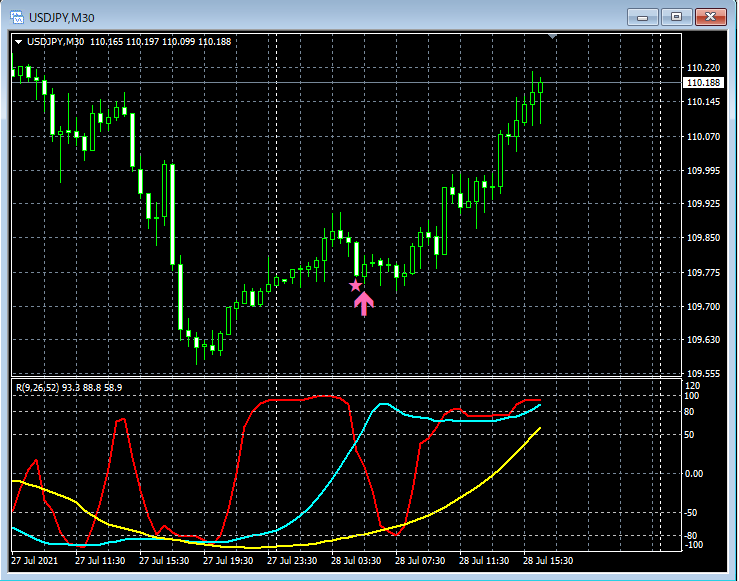
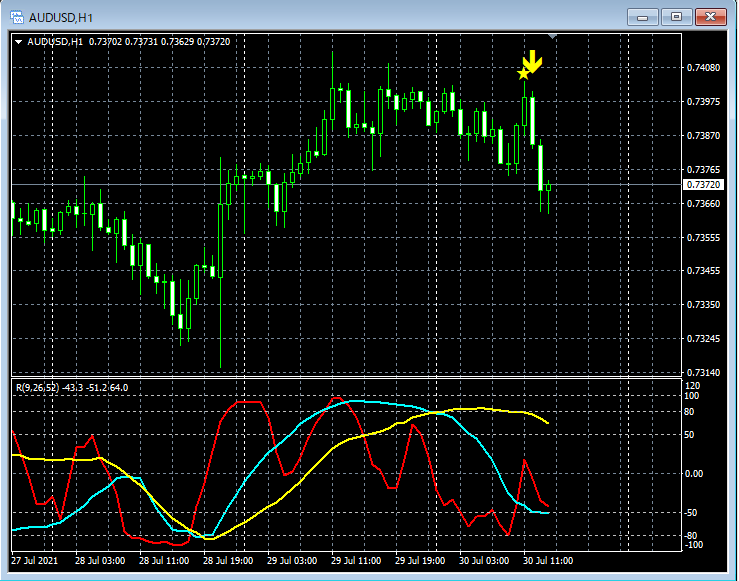
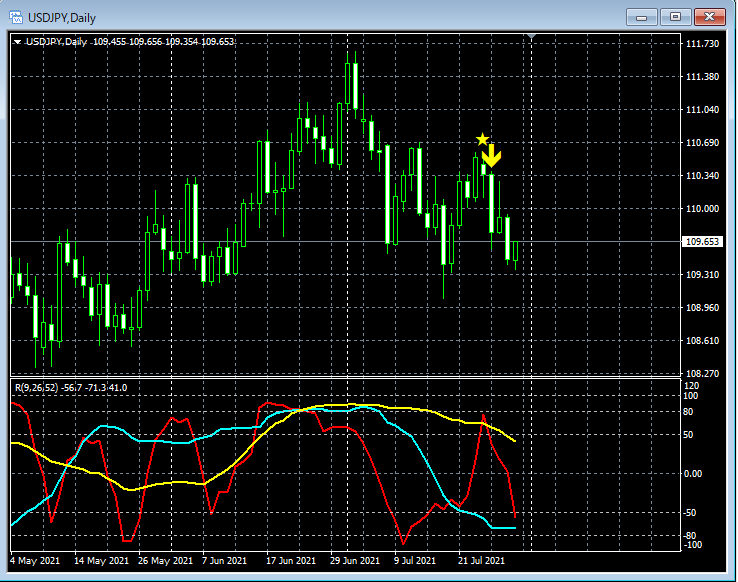
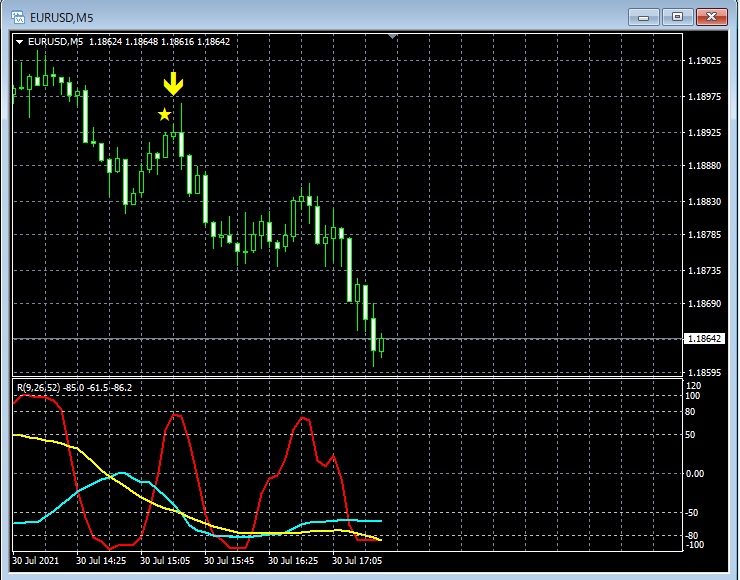
Below, we will pick up and introduce some examples from July 26 to July 30 where the mBDSR (RCI two-line filtered version) signals seem to have functioned well.
Indicator that shines when combined with RCI:【BODSOR・mBDSR】
https://www.gogojungle.co.jp/tools/indicators/11836
*An indicator developed to improve entry accuracy when using three RCI lines for buying on pullbacks or selling on rallies.
A bonus PDF file with 150 items is included. Many of them are examples that break down the process into waiting for pullback buy or pullback sell timing (the mBDSR signal) on the lower timeframes by logically linking the higher and lower timeframes using the three RCI lines, and then examining multiple sub-timeframes sequentially. The descriptions use more than 550 charts .


