

An indicator that shines when combined with the RCI3 single line; examples of signs observed from March 1 to March 5 (Part 1)
Indicator that demonstrates power when combined with RCI: 【BODSOR・mBDSR】
https://www.gogojungle.co.jp/tools/indicators/11836
※ An indicator developed to improve entry accuracy when using three RCI lines for buying on dips or selling near tops.
Includes 150 bonus PDF files. Many of them are examples that compile the process of logically linking higher and lower timeframes using three RCI lines, then sequentially considering the status of multiple lower timeframes, and finally waiting for the timing to buy on dips or sell on rallies (the mBDSR signals) on the lower timeframes.The explanations useover 550 charts.This page uses >items are 550 charts.
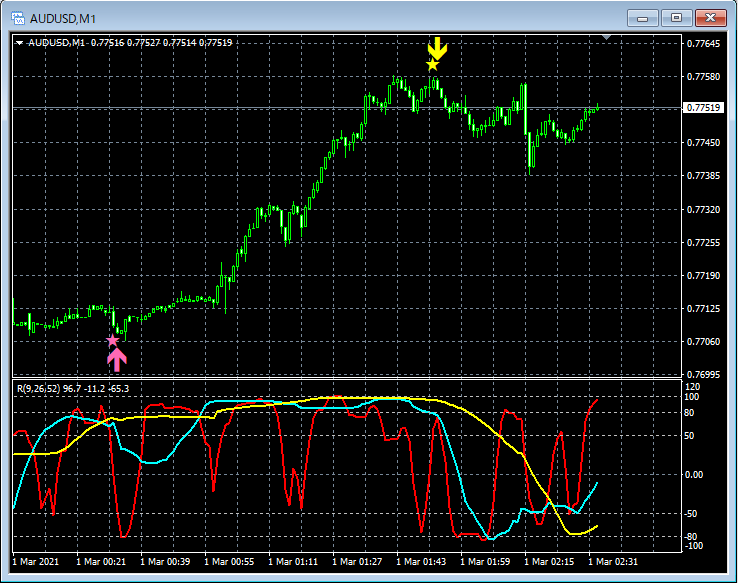
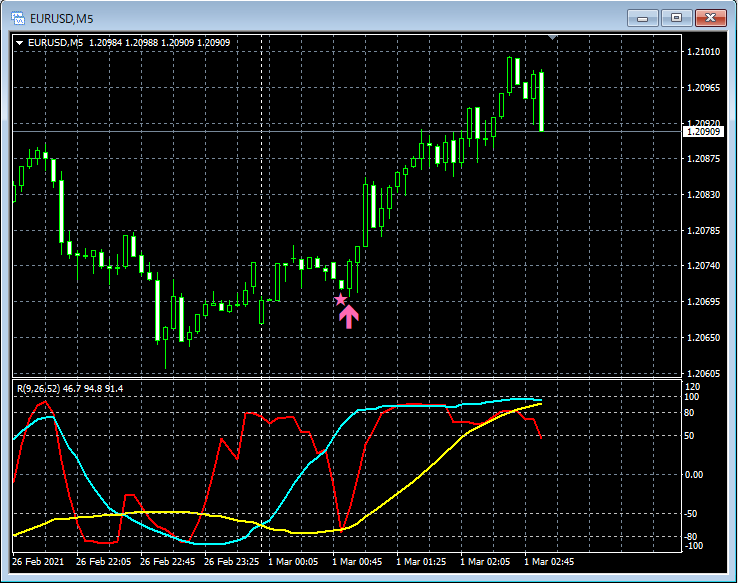
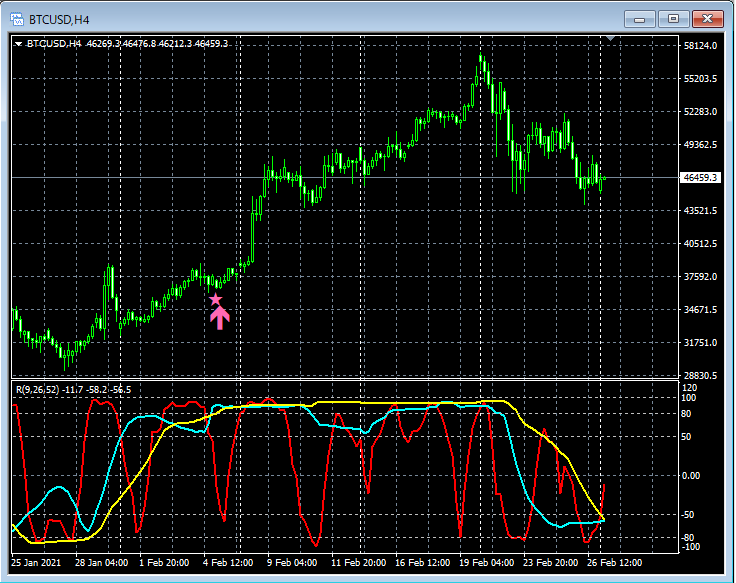
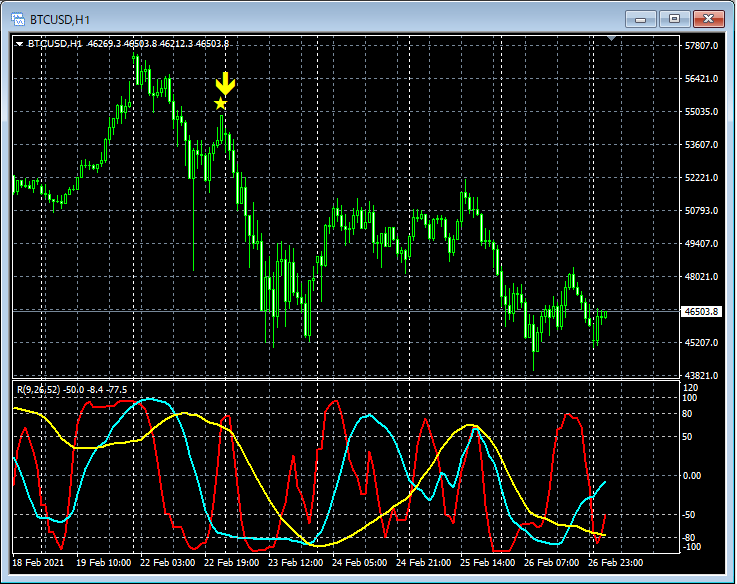
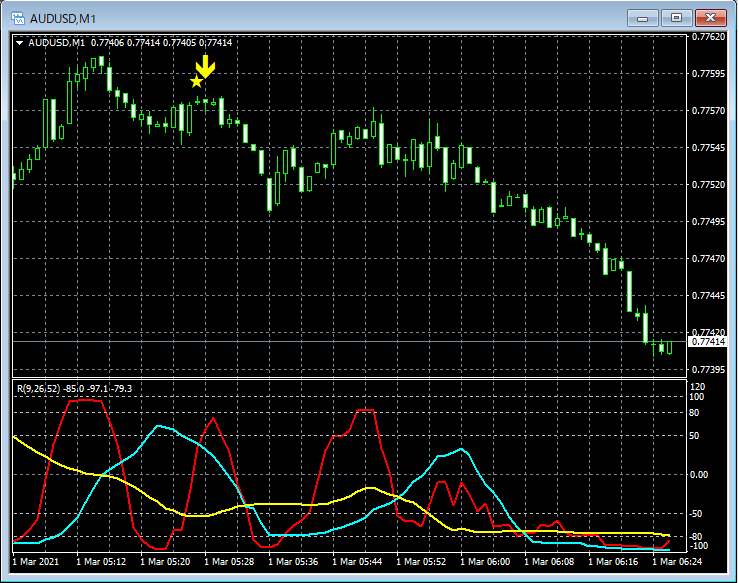
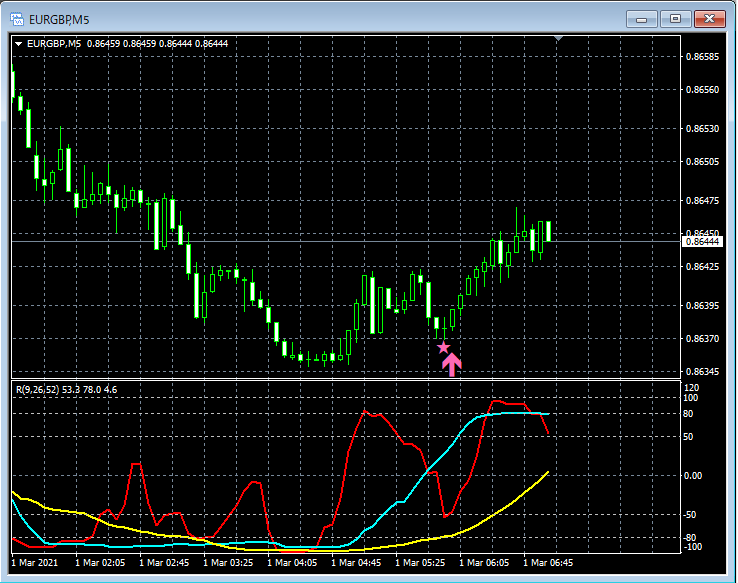
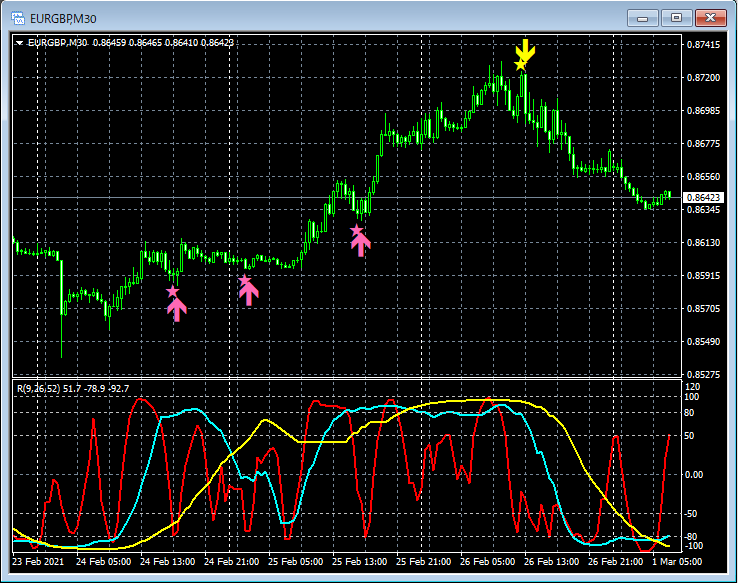
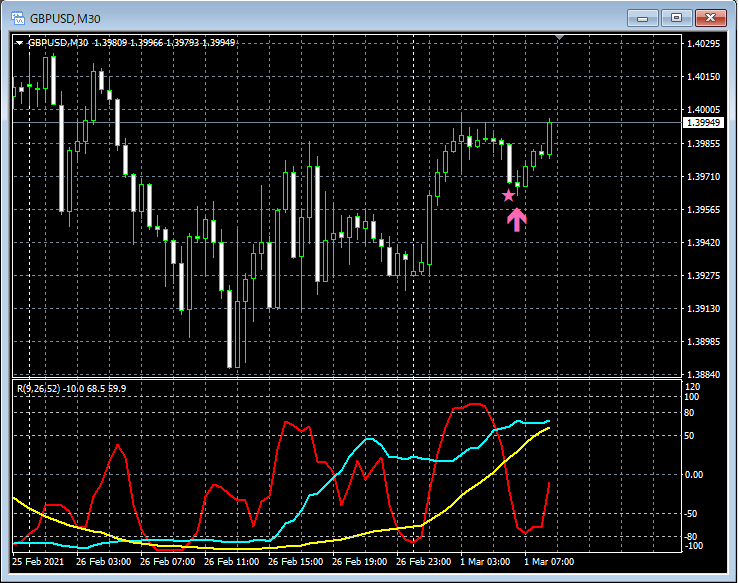
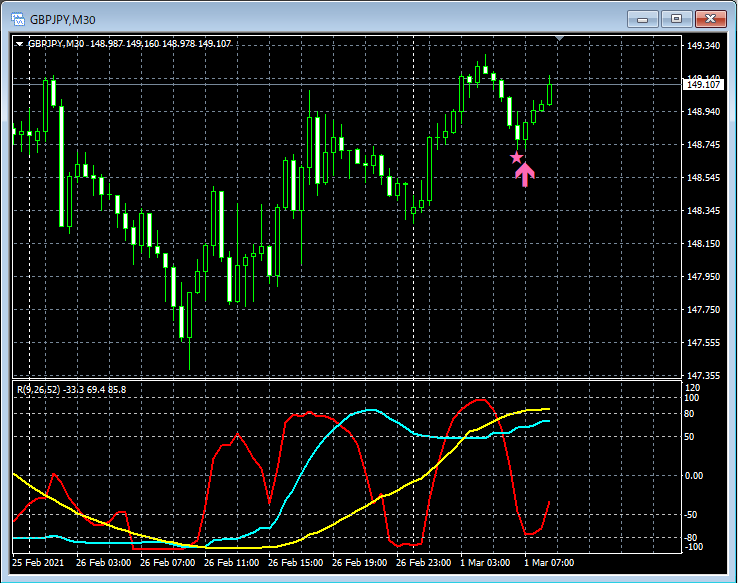
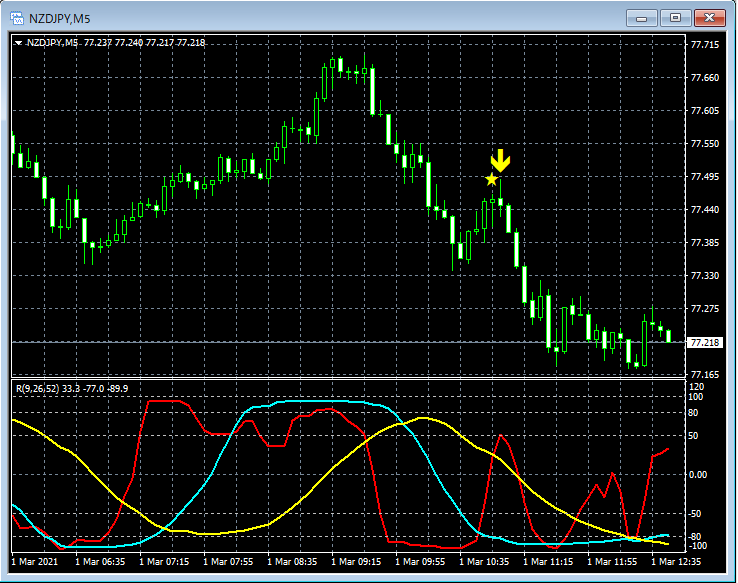
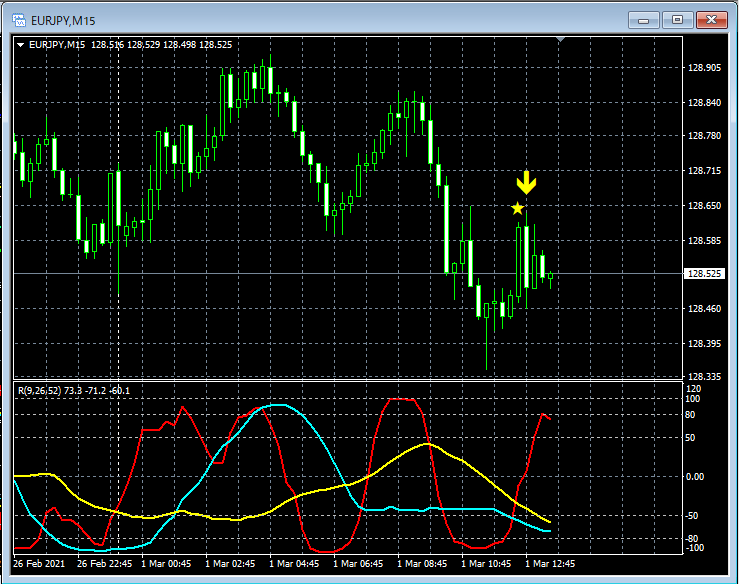
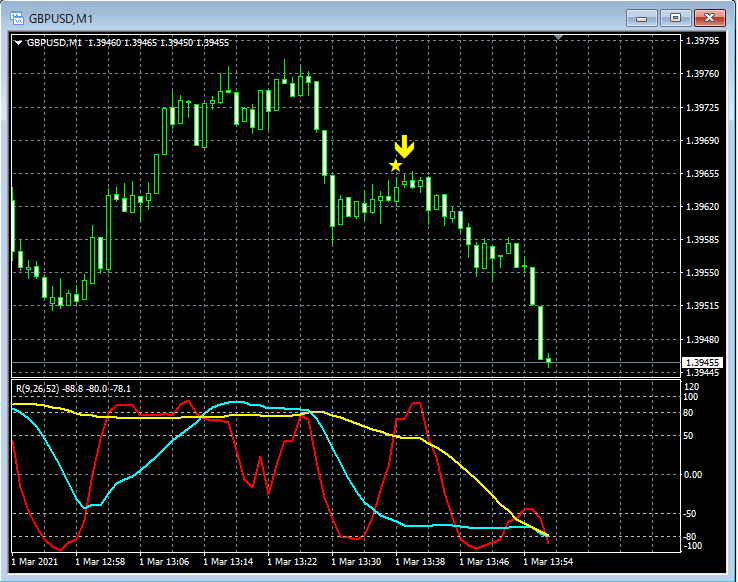
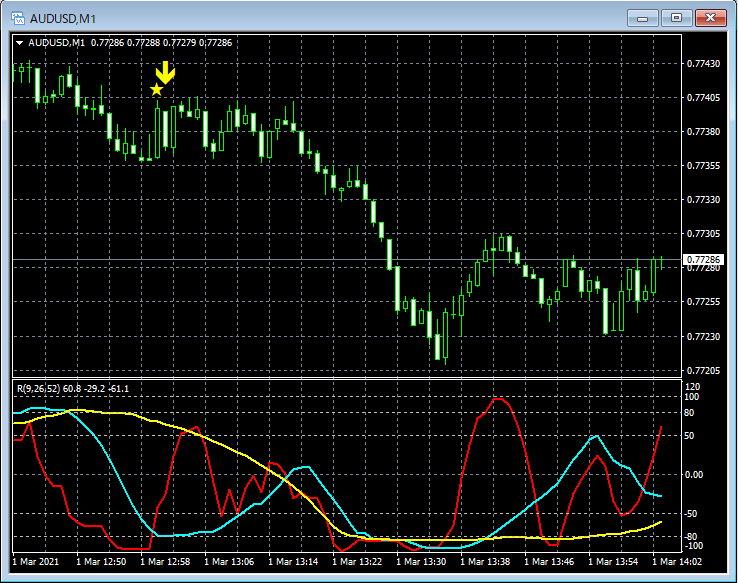
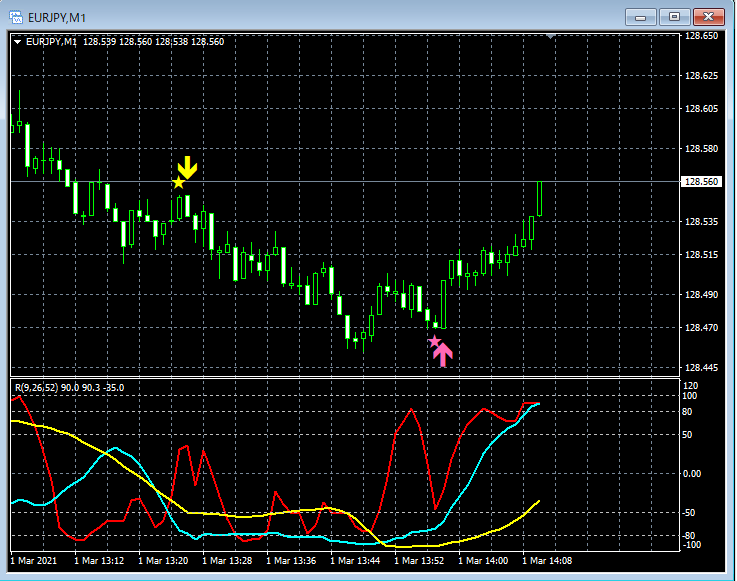
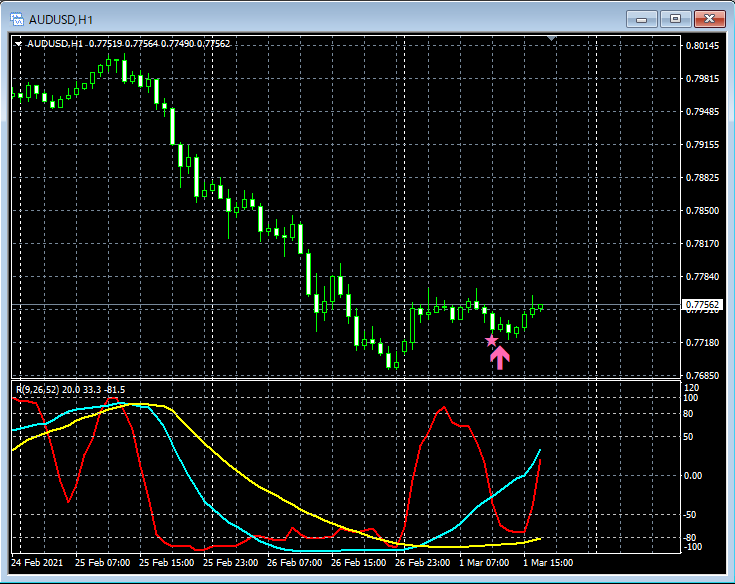
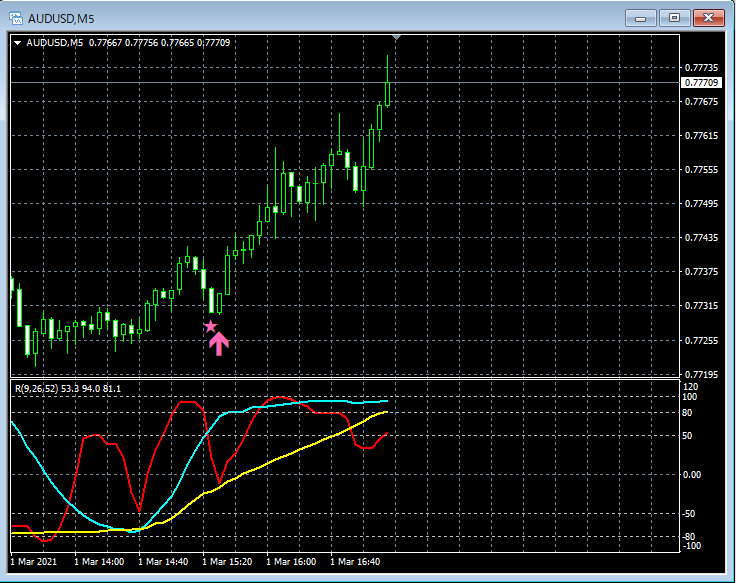
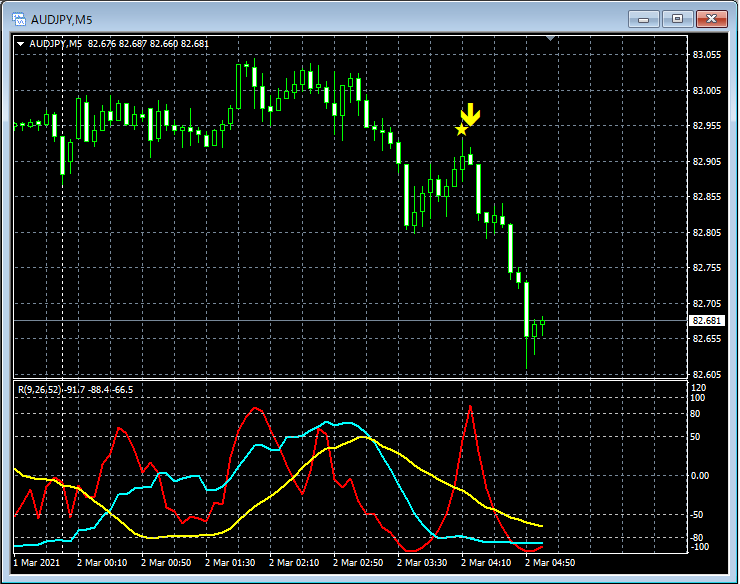
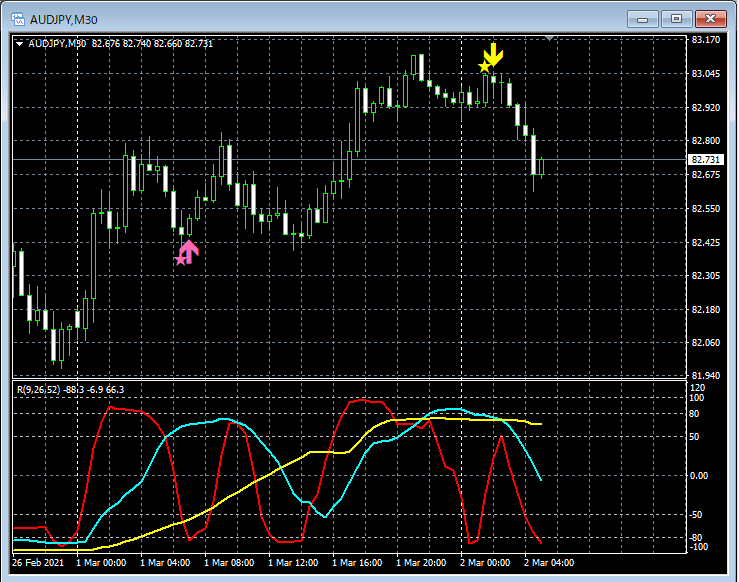
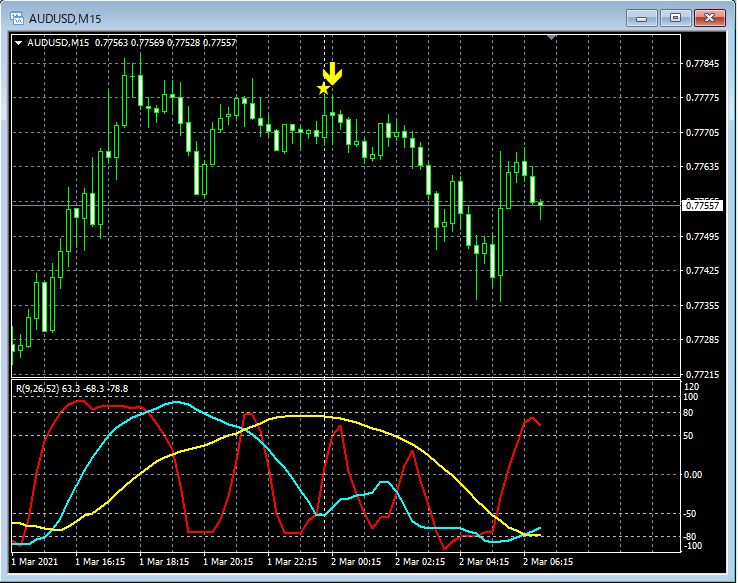
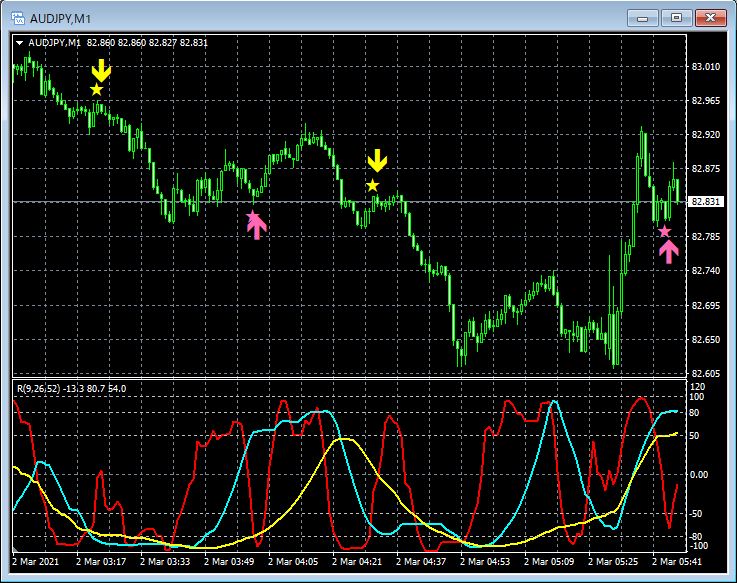
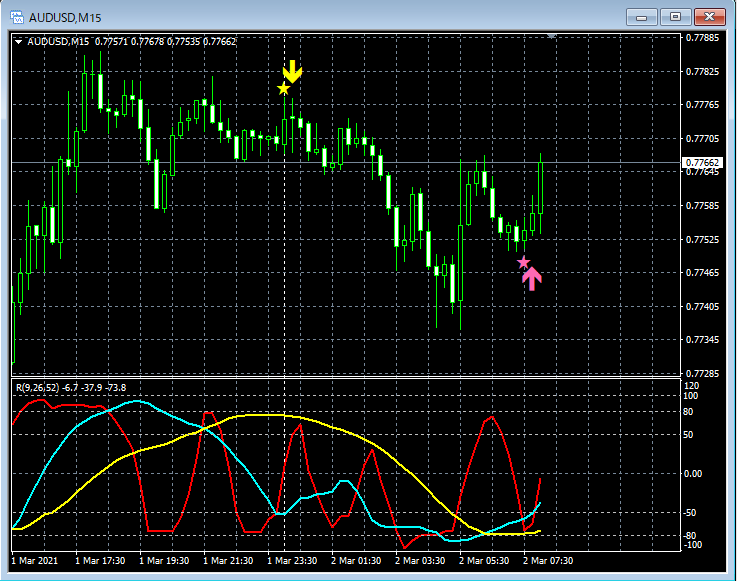
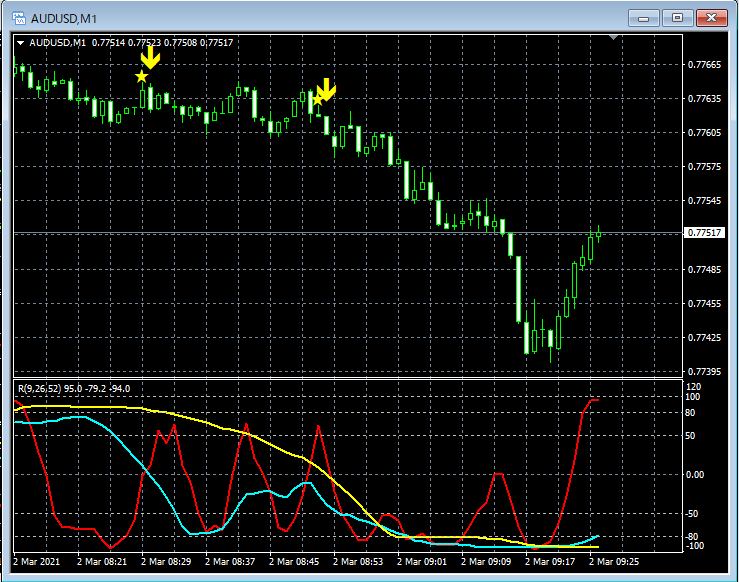
Below, from March 1 to March 5, we pick examples where the signals of mBDSR (RCI two-line filter version) appeared to function well, and divide them into two articles. This is the first part of those articles.
1
2
3
4
5
6
7
8
9
10
11
12
13
14
15
16
17
18
19
20

21
22
23
24
25
26
27
Indicator that demonstrates power when combined with RCI: 【BODSOR・mBDSR】
https://www.gogojungle.co.jp/tools/indicators/11836
※ An indicator developed to improve entry accuracy when using three RCI lines for buying on dips or selling near tops.
Includes 150 bonus PDF files. Many of them are examples that compile the process of logically linking higher and lower timeframes using three RCI lines, then sequentially considering the status of multiple lower timeframes, and finally waiting for the timing to buy on dips or sell on rallies (the mBDSR signals) on the lower timeframes.The explanations useover 550 charts.This uses over 550 charts.


