

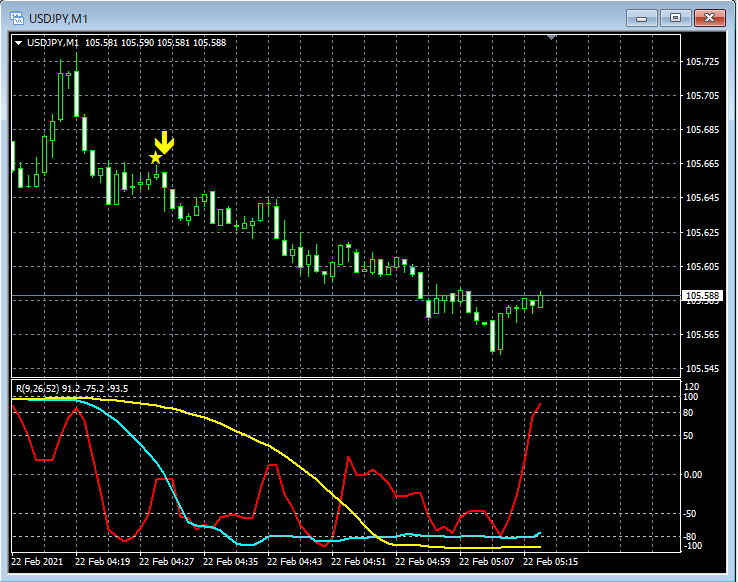
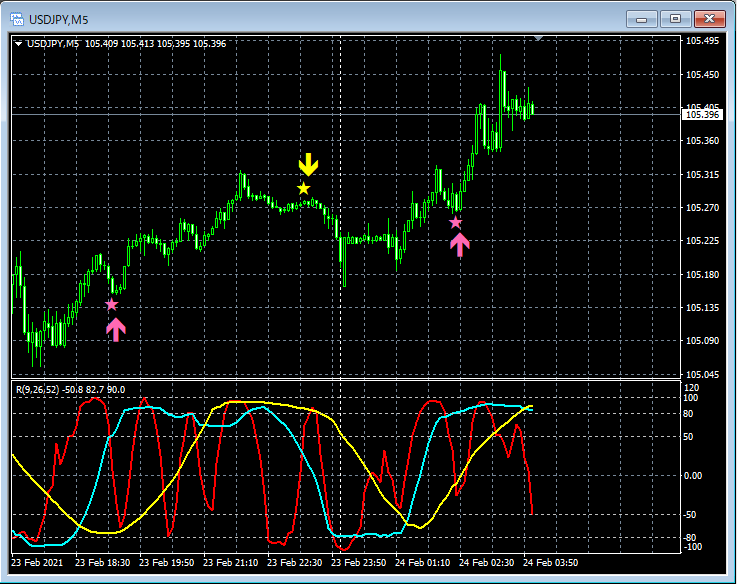
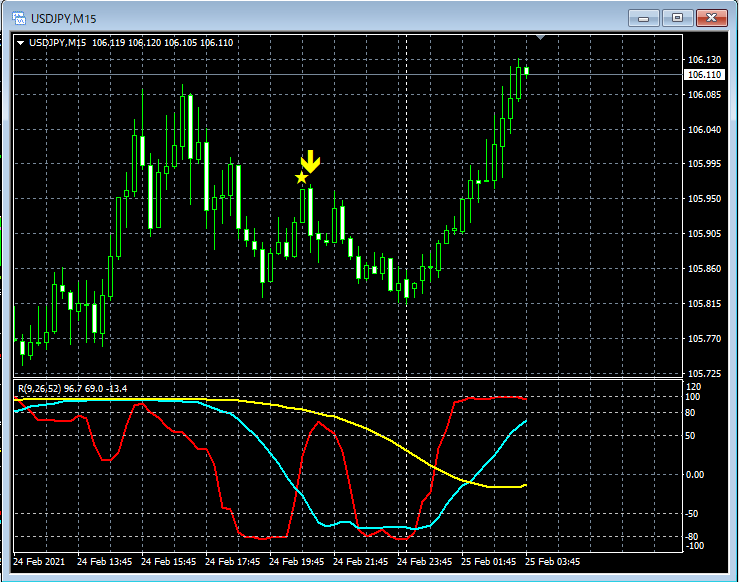
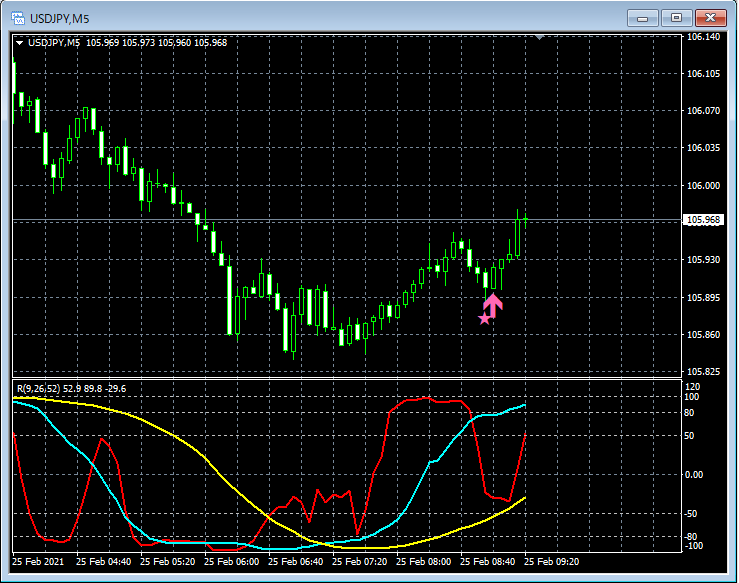
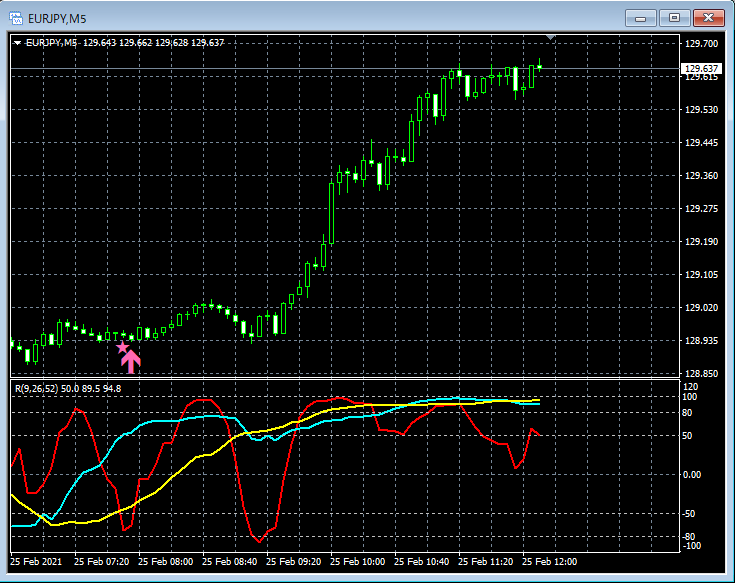
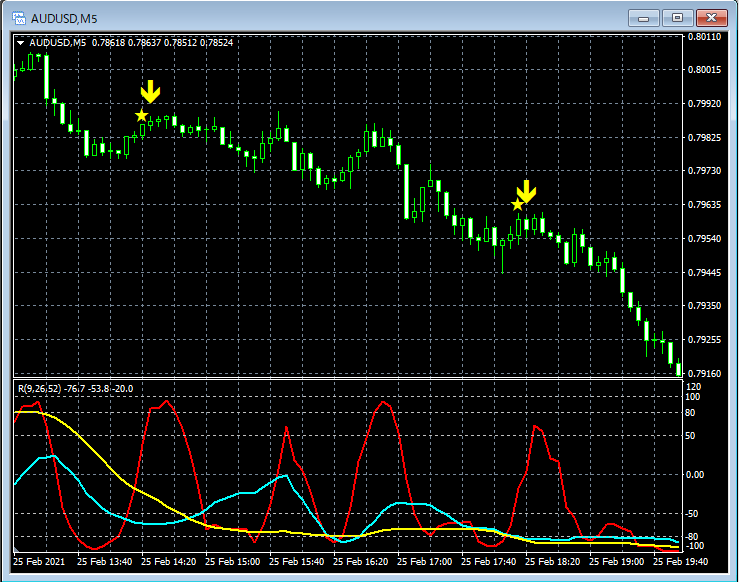
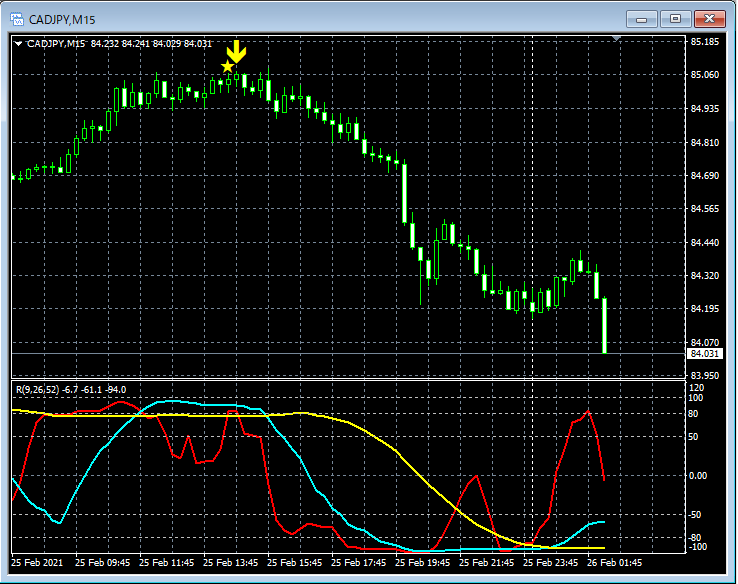
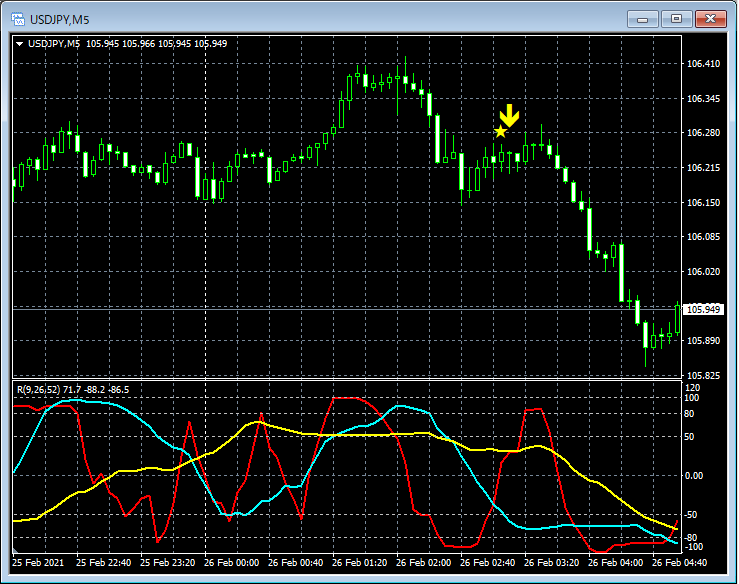
Indicator that shows power when combined with the RCI3 single line; examples of signs observed from February 22 to February 26
Indicator that unleashes power when combined with RCI【BODSOR・mBDSR】
https://www.gogojungle.co.jp/tools/indicators/11836
※ An indicator developed to improve entry accuracy when using three RCI lines for upside buying or pullback selling
Bonus PDF files are included: 150 in total.Many of them areexamples that link higher-timeframe and lower-timeframe logically using three RCI lines, sequentially examining the status of multiple lower timeframes, and ultimately waiting for a timing to buy on dips or sell on pullbacks on the lower timeframe (i.e., mBDSR signals).This is what they are. The description usesmore than 550 chartsin total.
Below, from February 22 to February 26, we pick up and introduce examples where the mBDSR (RCI two-line filter version) signals seemed to work well.
This week, it seems there were more opportunities to focus on the MA filter version signals than on the RCI two-line filter version signals.
1
2

3
4
5
6
7
8
9
10

11

12

13

14

Indicator that unleashes power when combined with RCI【BODSOR・mBDSR】
https://www.gogojungle.co.jp/tools/indicators/11836
※ An indicator developed to improve entry accuracy when using three RCI lines for upside buying or pullback selling
Bonus PDF files are included: 150 in total.Many of them areexamples that link higher-timeframe and lower-timeframe logically using three RCI lines, sequentially examining the status of multiple lower timeframes, and ultimately waiting for a timing to buy on dips or sell on pullbacks on the lower timeframe (i.e., mBDSR signals).This is what they are. The description usesmore than 550 chartsin total.


