

An indicator that shows its power when combined with the RCI3 single line; examples of signs observed from January 11 to January 15
Indicator that shows its power in combination with RCI【BODSOR・mBDSR】
https://www.gogojungle.co.jp/tools/indicators/11836
*An indicator developed to improve entry accuracy when using three RCI lines for buy-the-dip or sell-the-rallies
The bonus PDF file includes 150 items.Most of them areexamples that concretize the approach of logically linking higher and lower timeframes using three RCI lines to sequentially analyze multiple lower timeframes, ultimately waiting for the timing of buy-the-dip or sell-the-rally on the lower timeframe (the mBDSR signal).and are compiled as such. The explanation usesmore than 550 chartsin total.
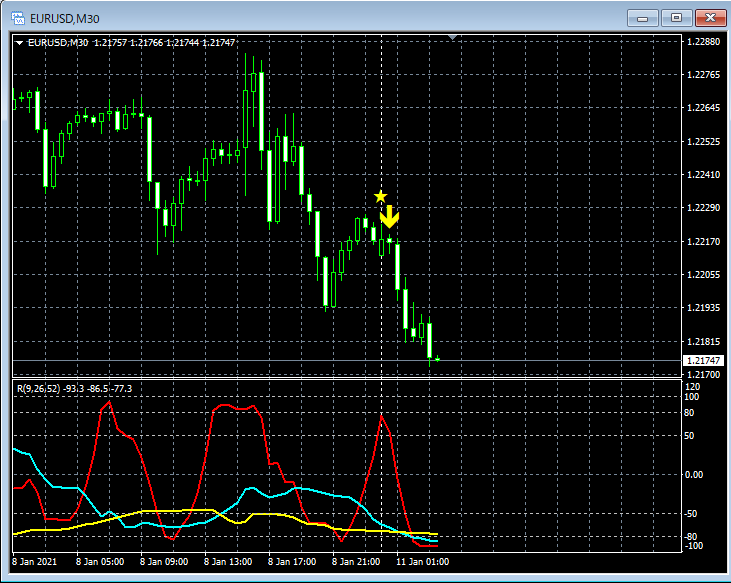
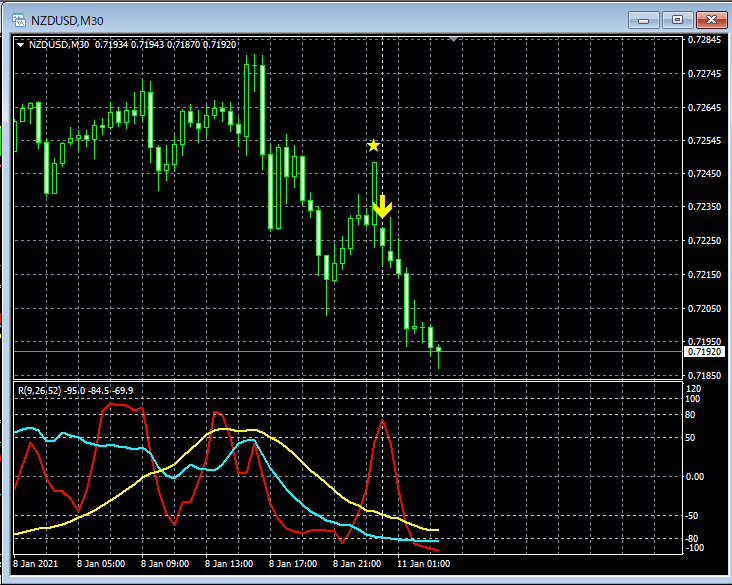
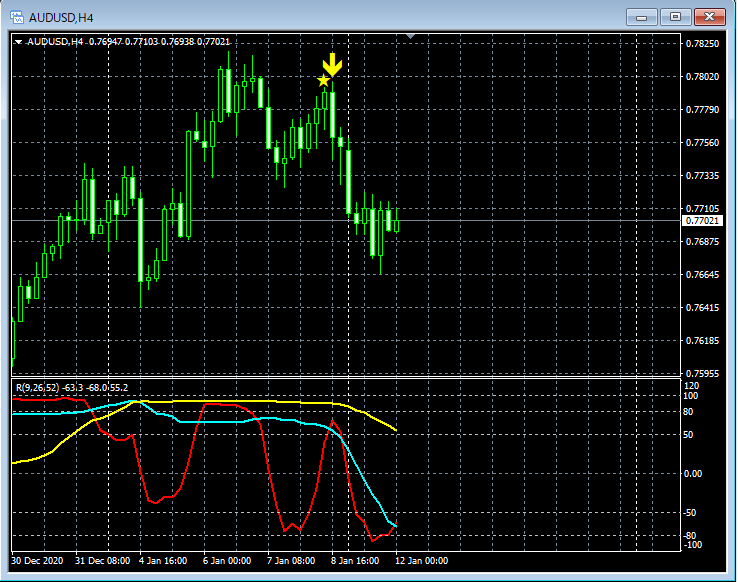
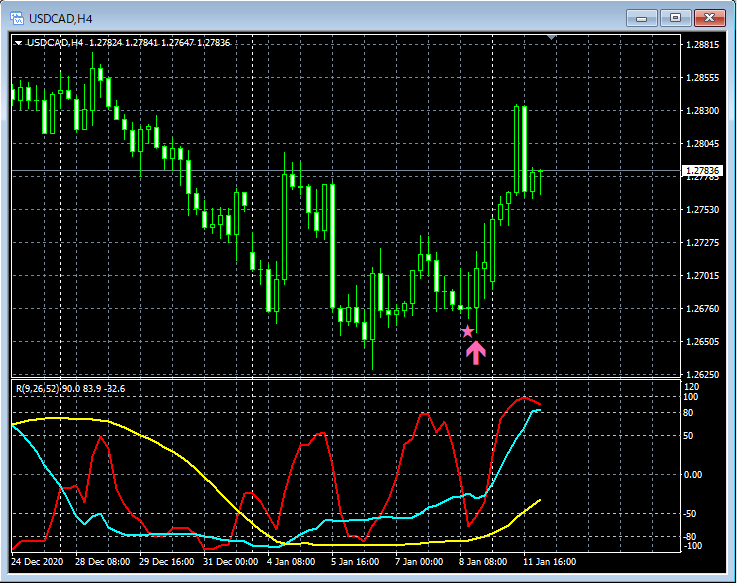
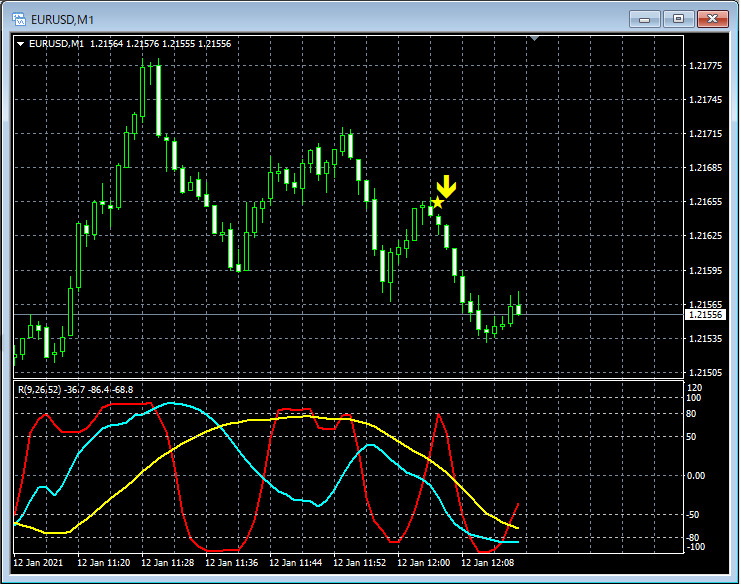
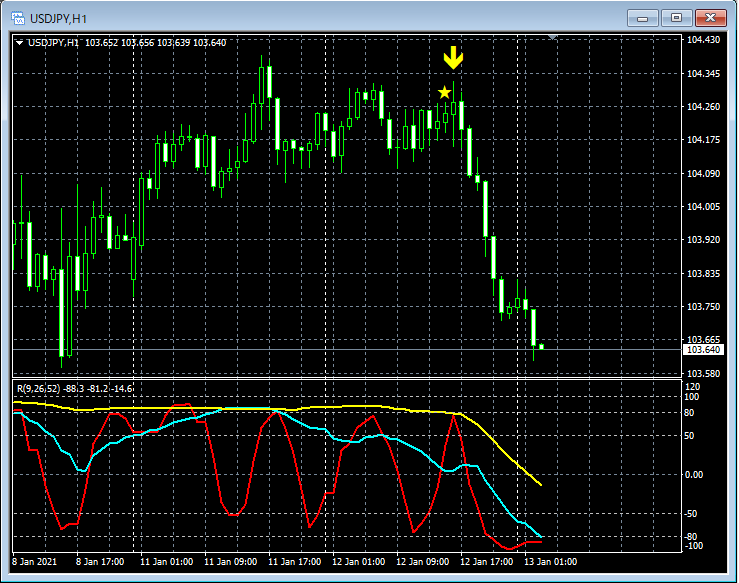
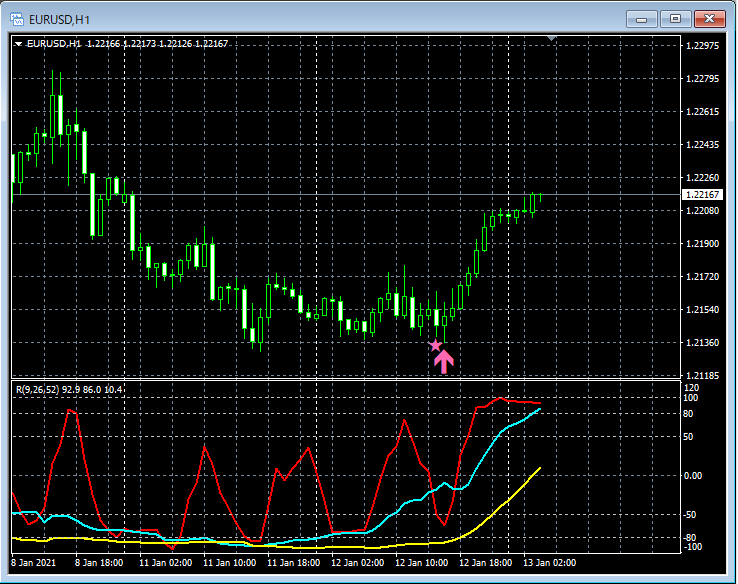
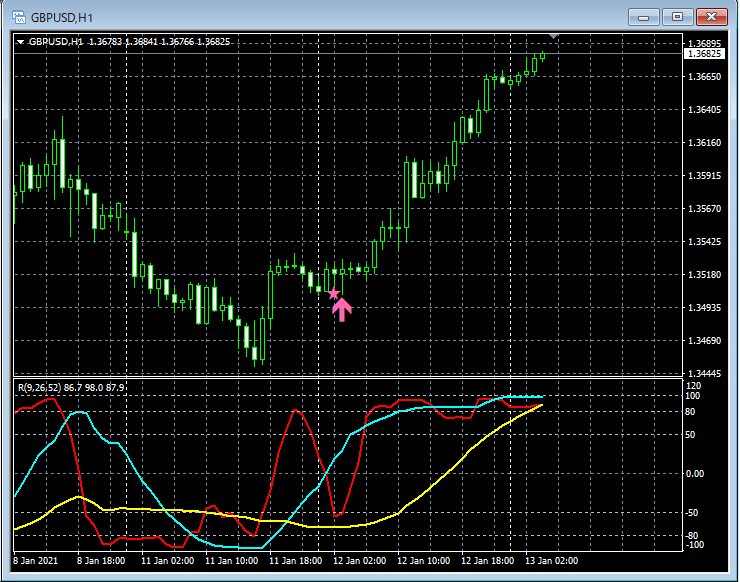
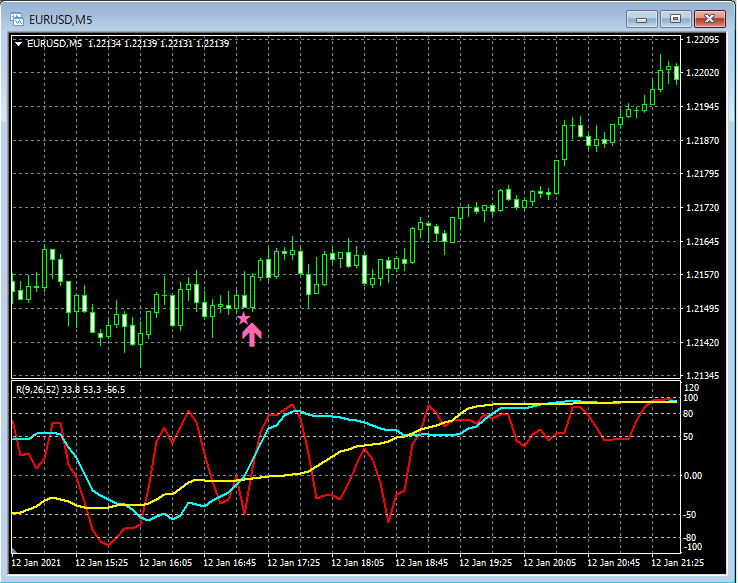
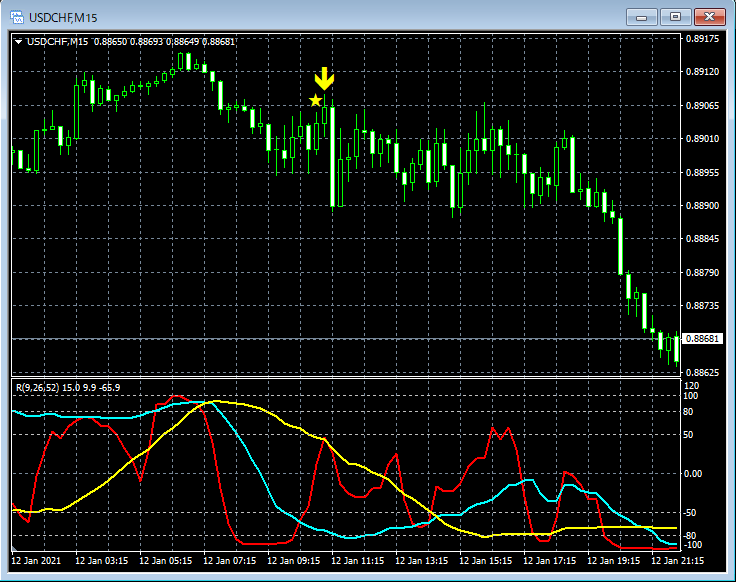
Below, from January 11 to January 15, we pick up and introduce examples where the mBDSR (RCI two-line filter version) signals seemed to work well.
1
2
3
4
5
6
7
8
9

10

11

12
13
14

15

16

17

18

19

20

21

22

23

24

25

Indicator that shows its power in combination with RCI【BODSOR・mBDSR】
https://www.gogojungle.co.jp/tools/indicators/11836
*An indicator developed to improve entry accuracy when using three RCI lines for buy-the-dip or sell-the-rallies
The bonus PDF file includes 150 items.Most of them areexamples that concretize the approach of logically linking higher and lower timeframes using three RCI lines to sequentially analyze multiple lower timeframes, ultimately waiting for the timing of buy-the-dip or sell-the-rally on the lower timeframe (the mBDSR signal).and are compiled as such. The explanation usesmore than 550 chartsin total.


