

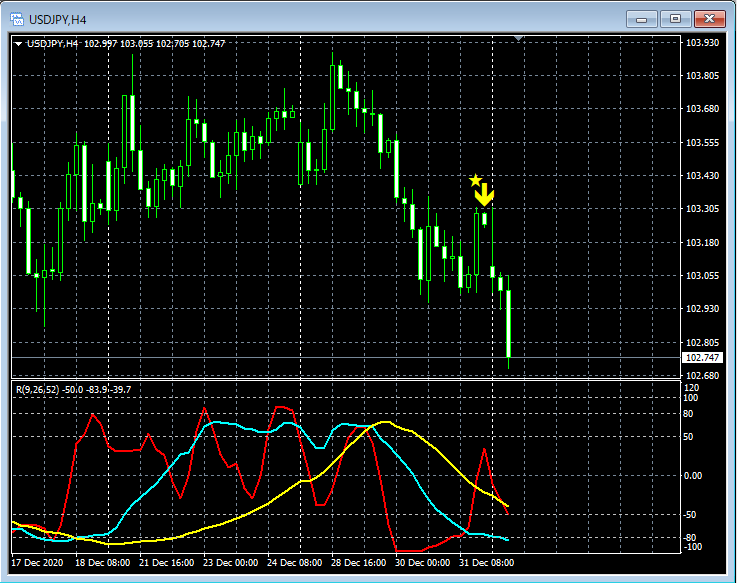
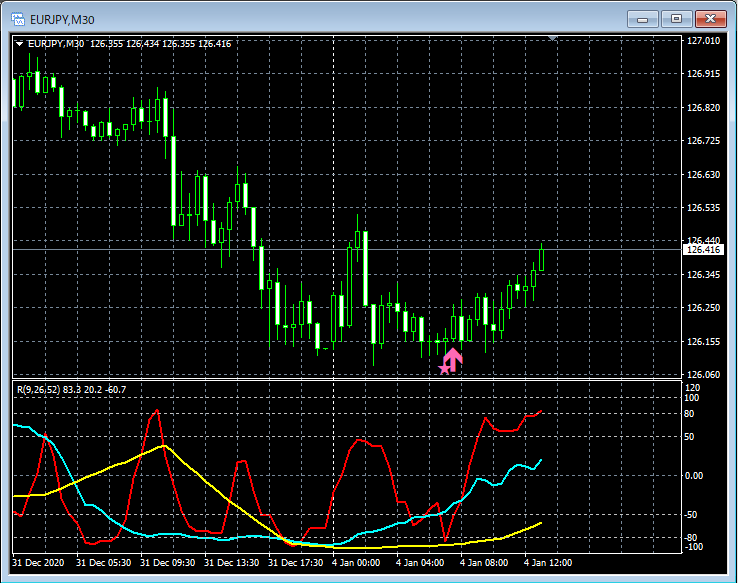
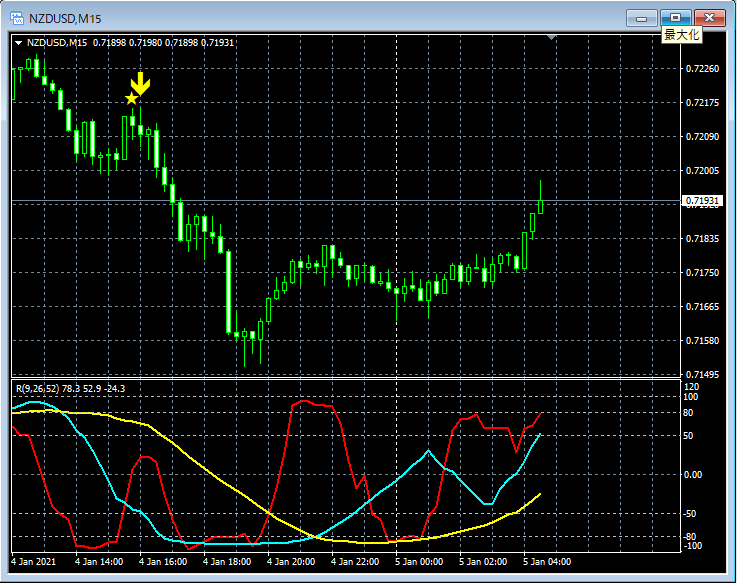
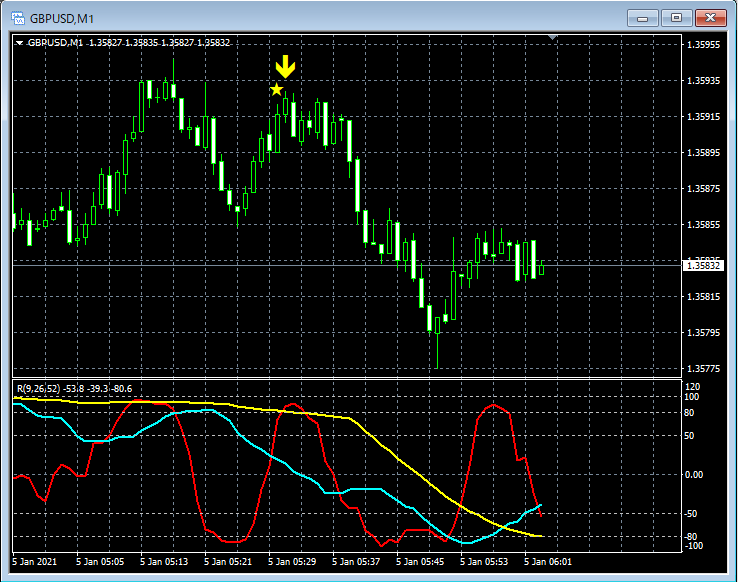
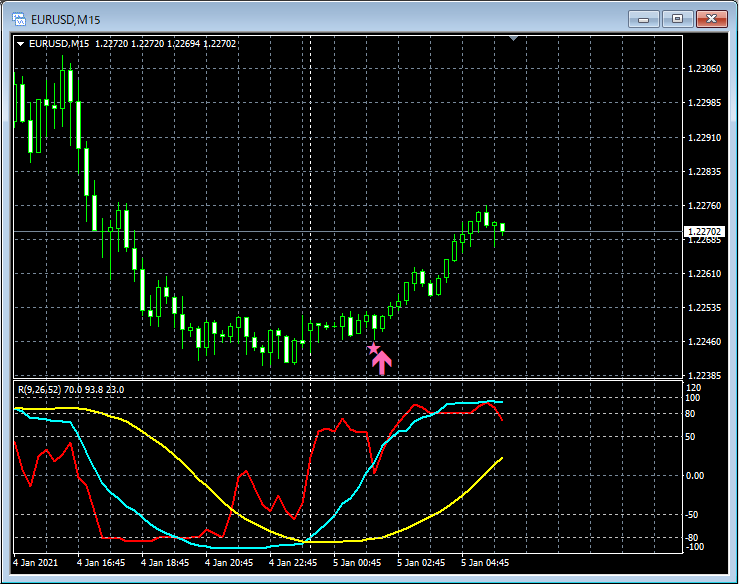
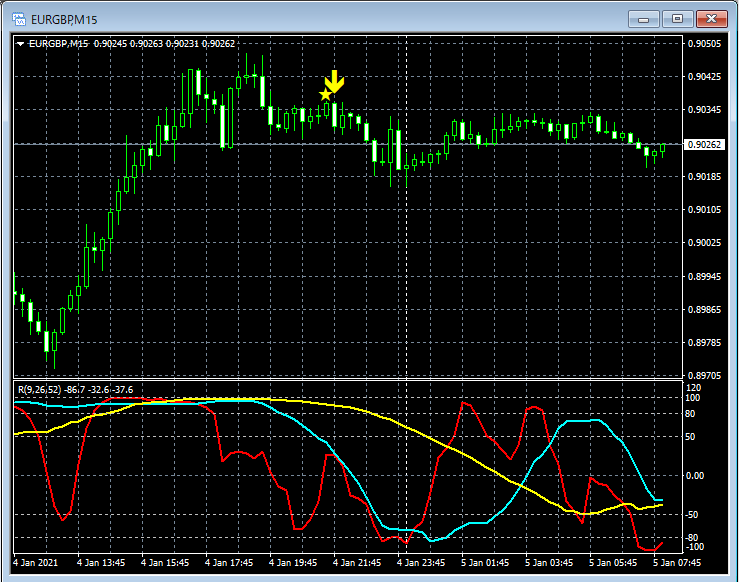
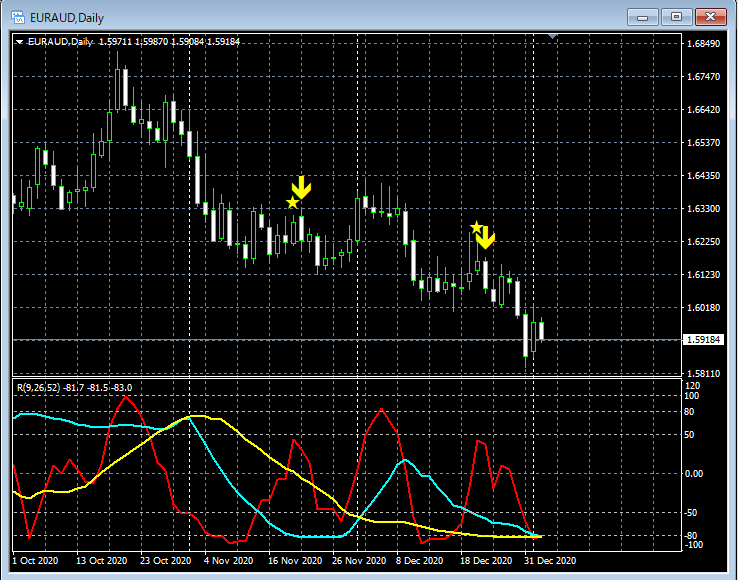
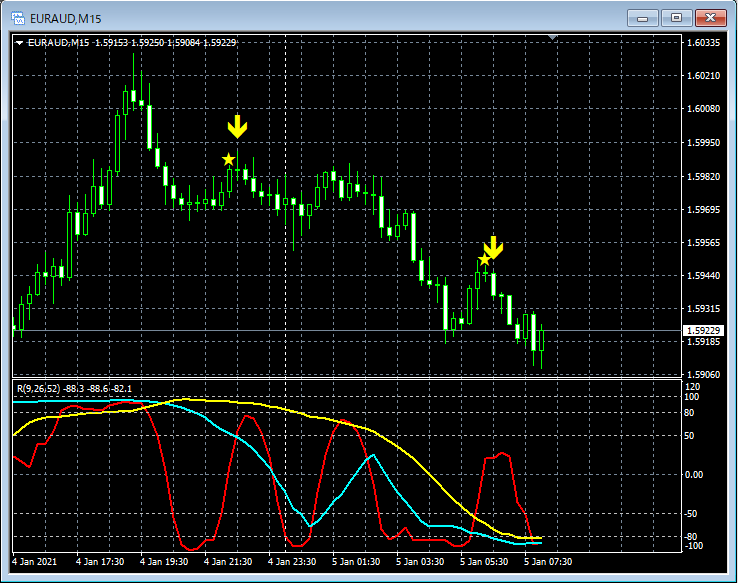
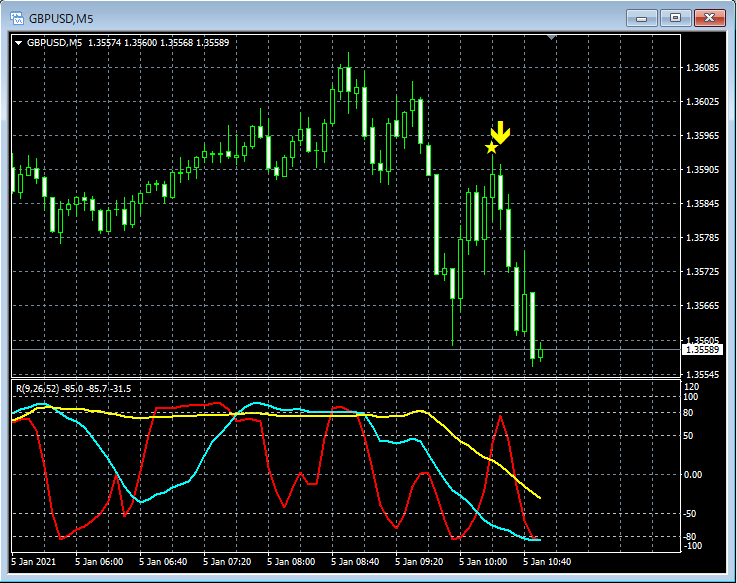
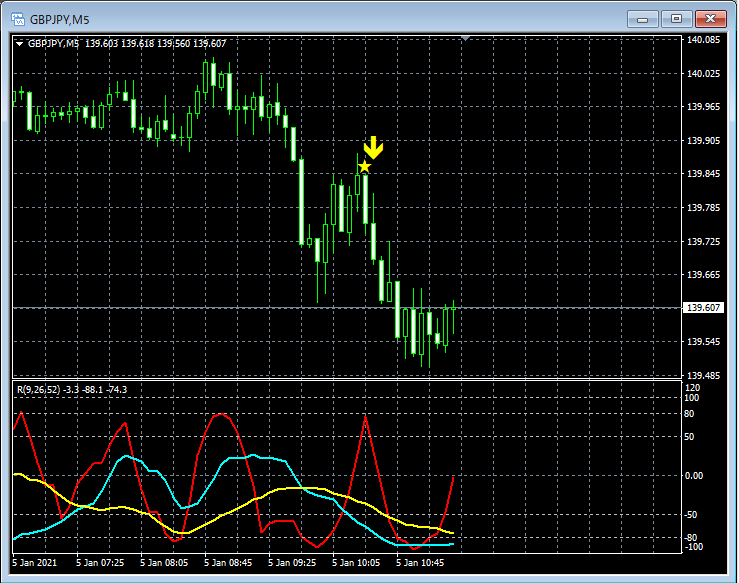
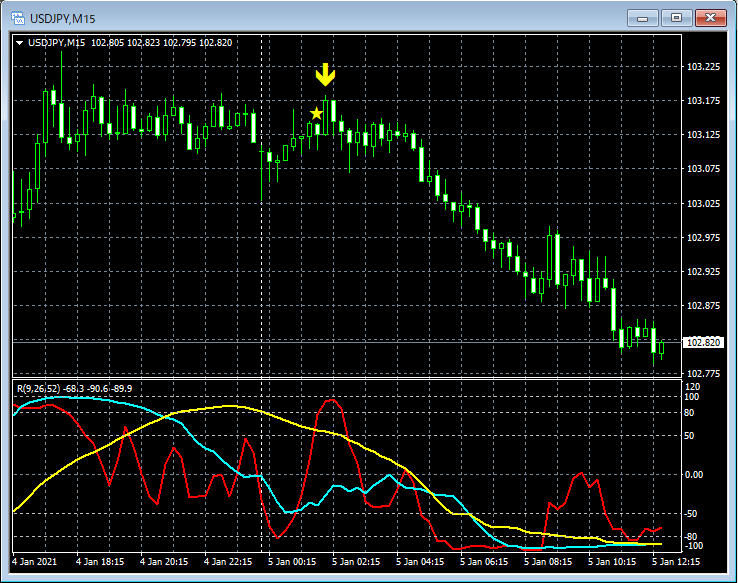
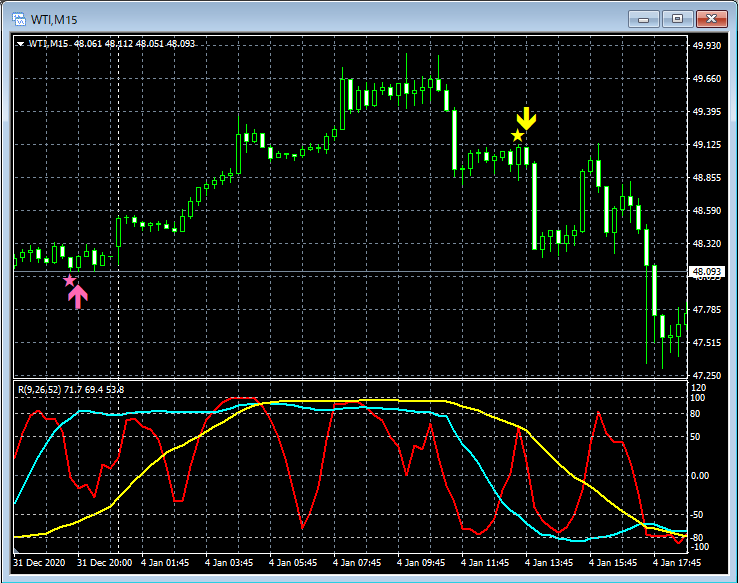
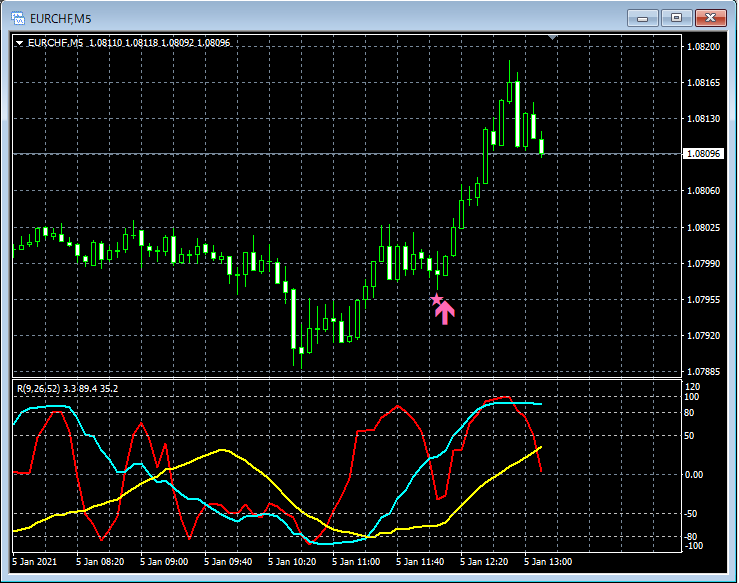
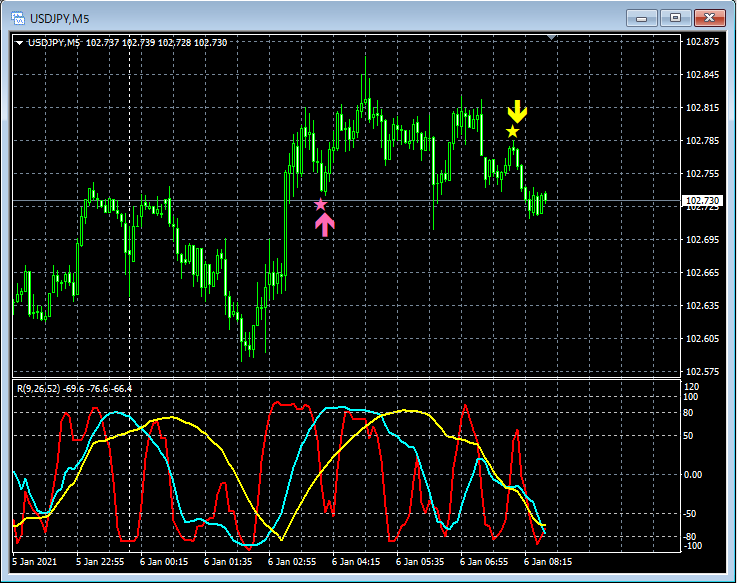
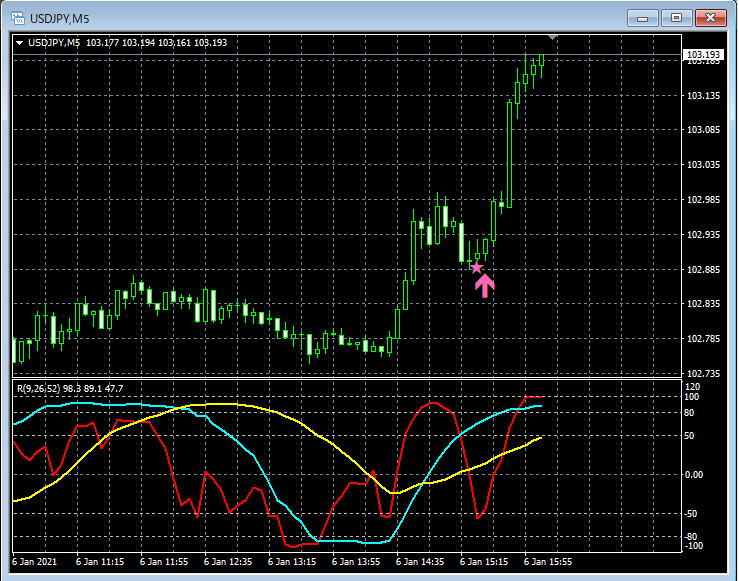
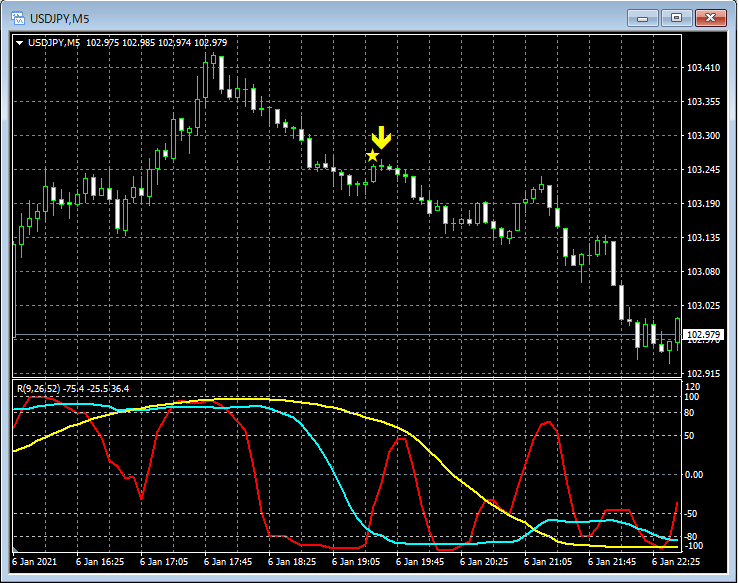
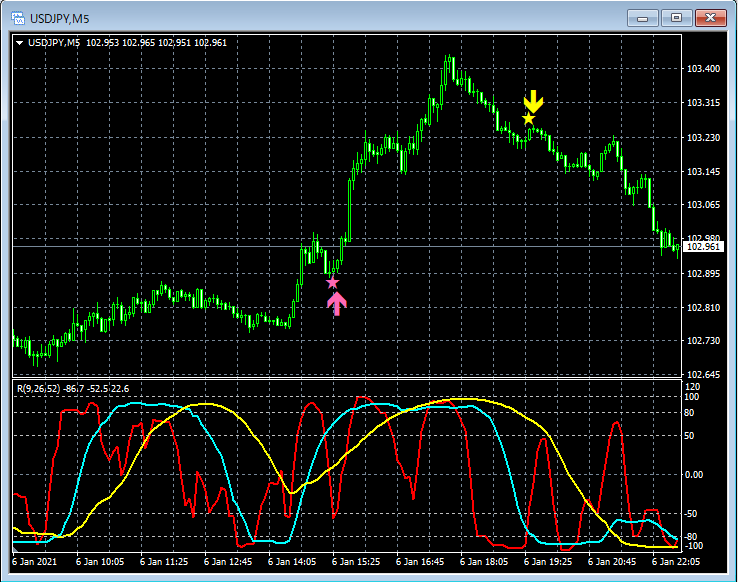
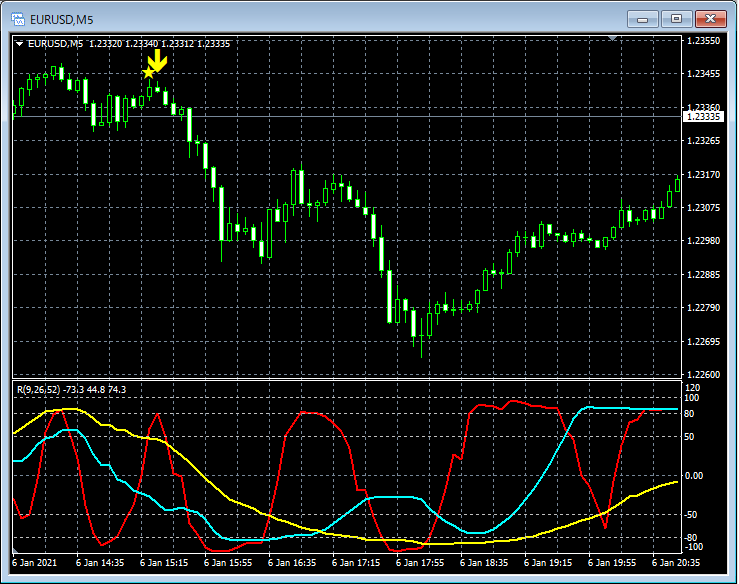
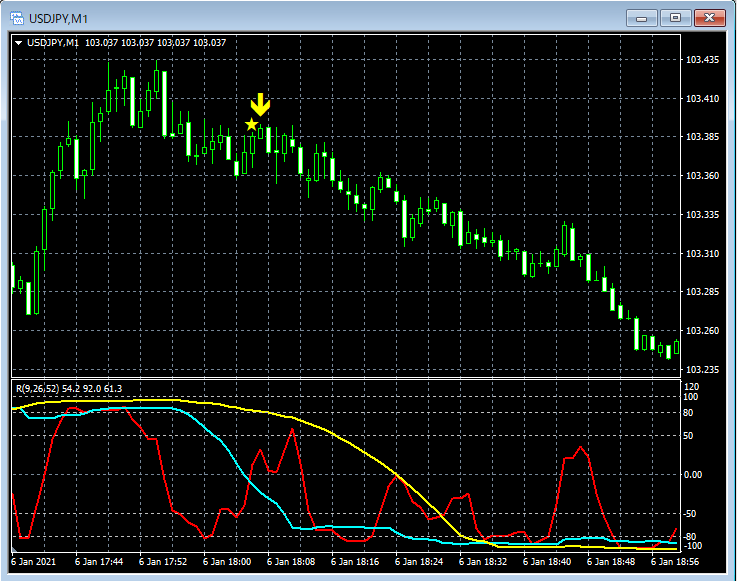
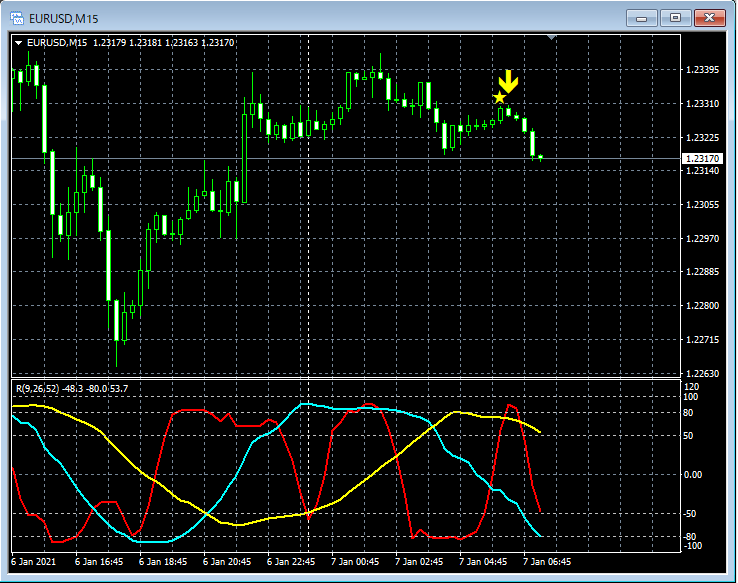
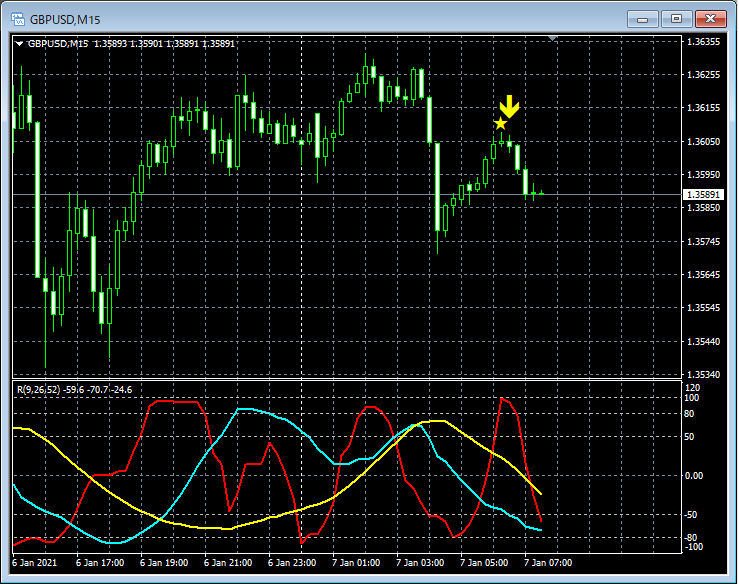
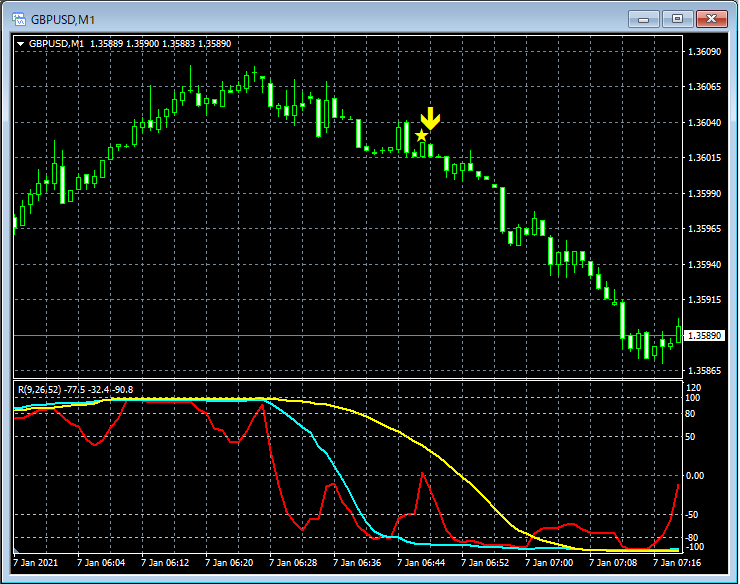
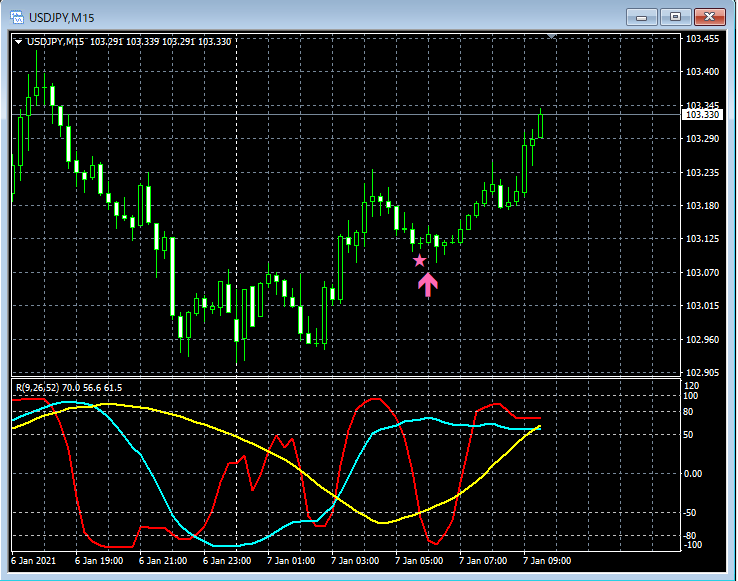
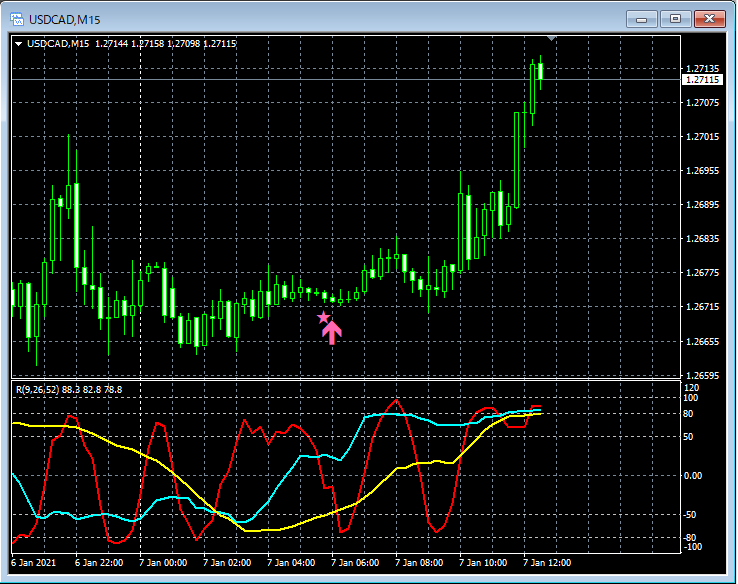
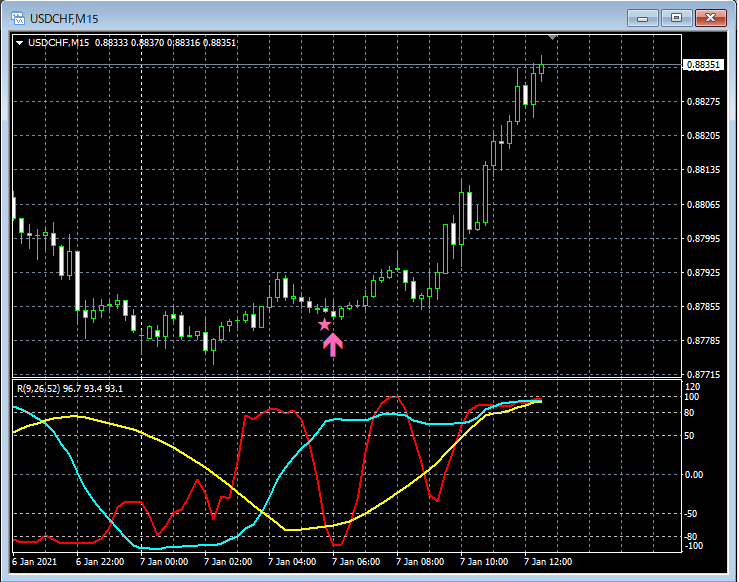
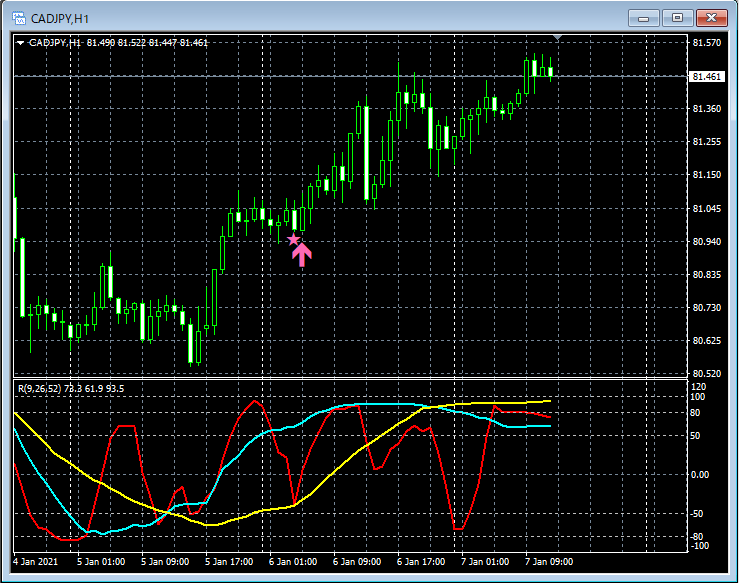
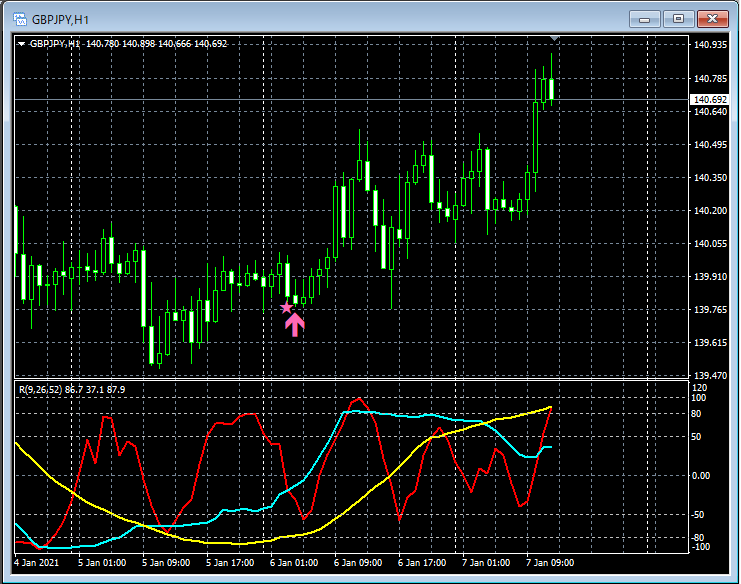
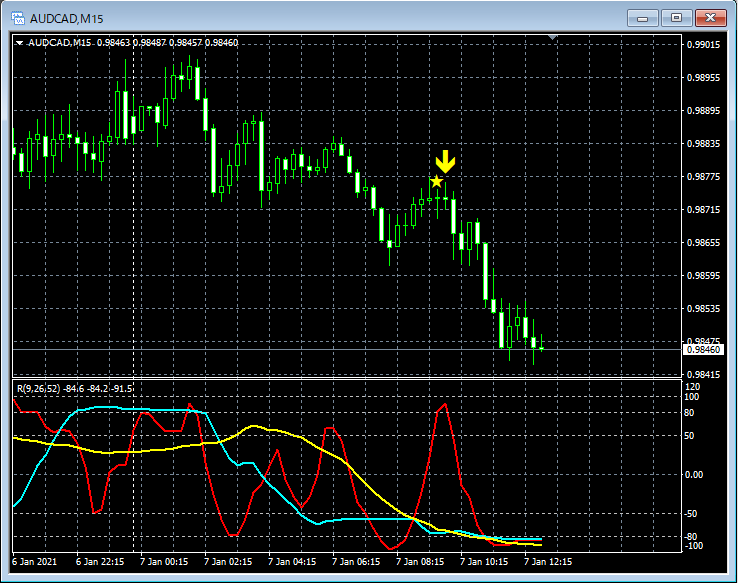
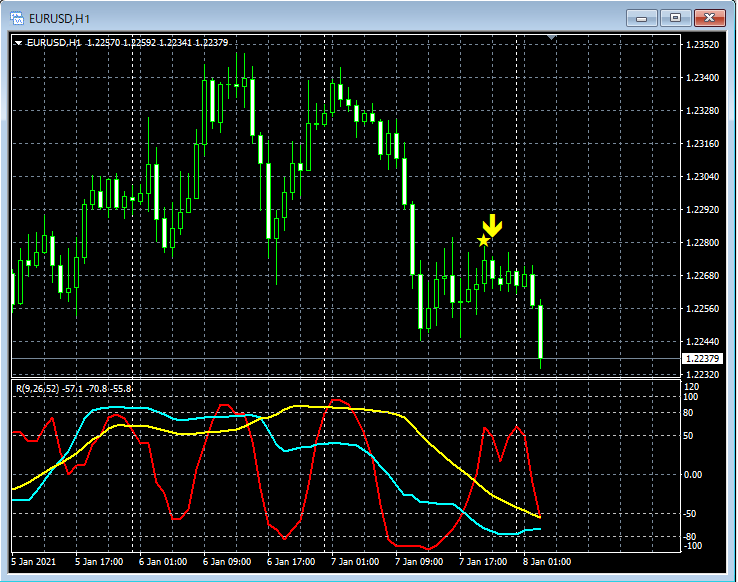
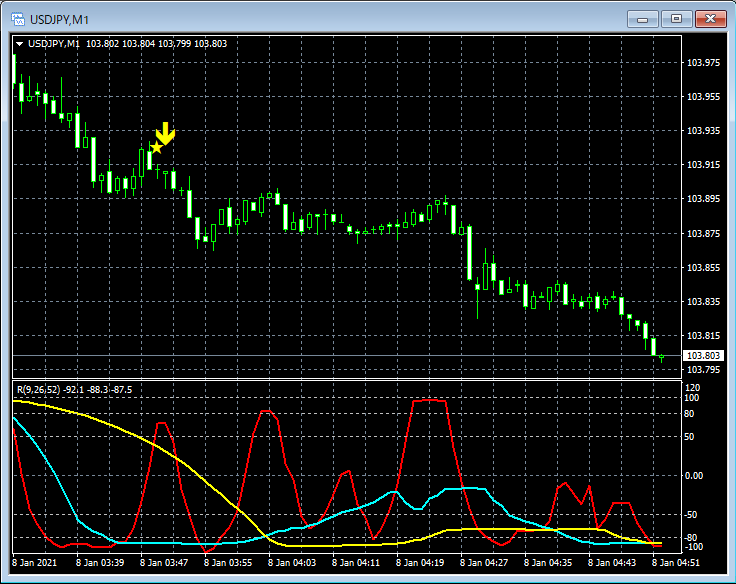
Indicator that gains power when combined with the RCI3 single line; examples of signals observed from January 4 to January 8
Indicator that works best in combination with RCI: BODSOR/mBDSR
https://www.gogojungle.co.jp/tools/indicators/11836
※ An indicator developed to improve entry accuracy when using three RCI lines for buy-the-dip or sell-the-rallies.
The bonus PDF file contains 150 items.Most of them are examples that have been compiled to logically link higher and lower timeframes using three RCI lines, gradually considering multiple lower timeframes and ultimately waiting for the timing to buy on dips or sell on rallies on the lower timeframe (i.e., the mBDSR signal).described as being compiled from cases where the higher- and lower-timeframe linkage using the three RCI lines leads to a sequence of assessments of several sub-timeframes, culminating in the timing for dip buying or rally selling on the lower timeframe (the mBDSR signal).They aremore than 550 chartsThe explanation uses.
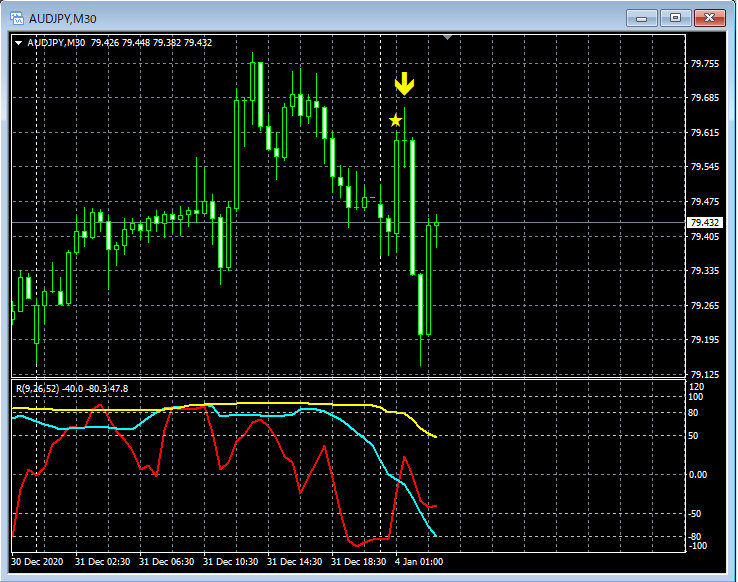
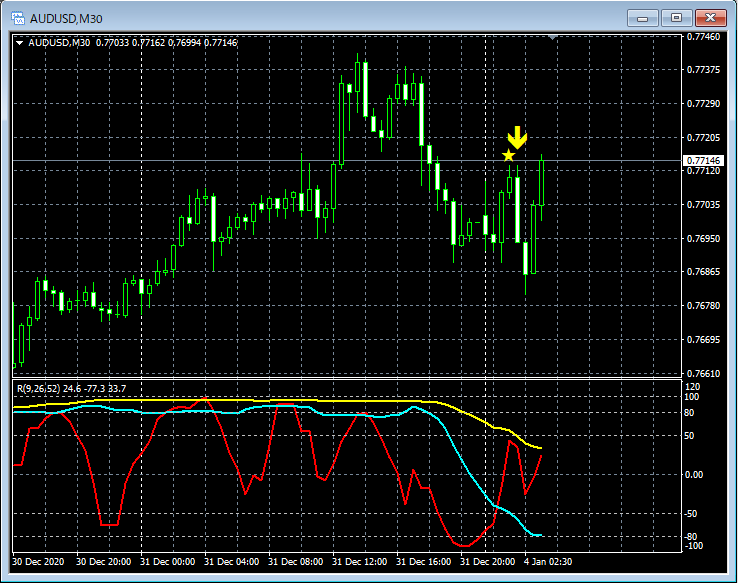
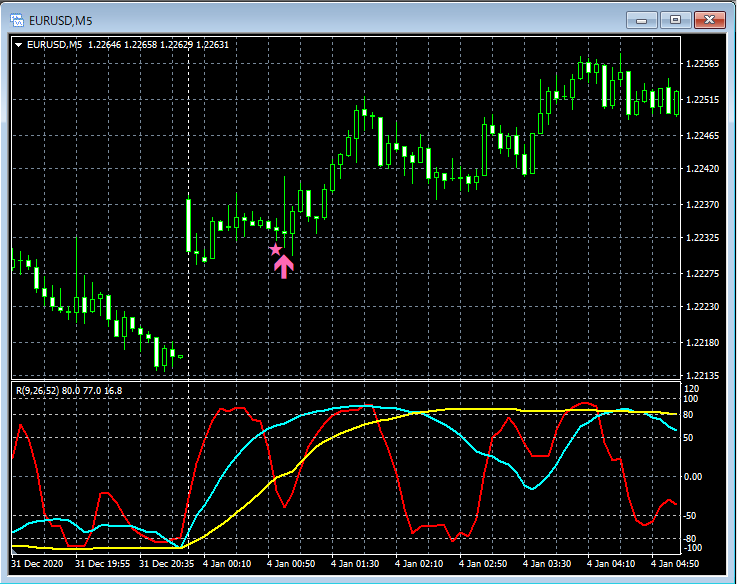
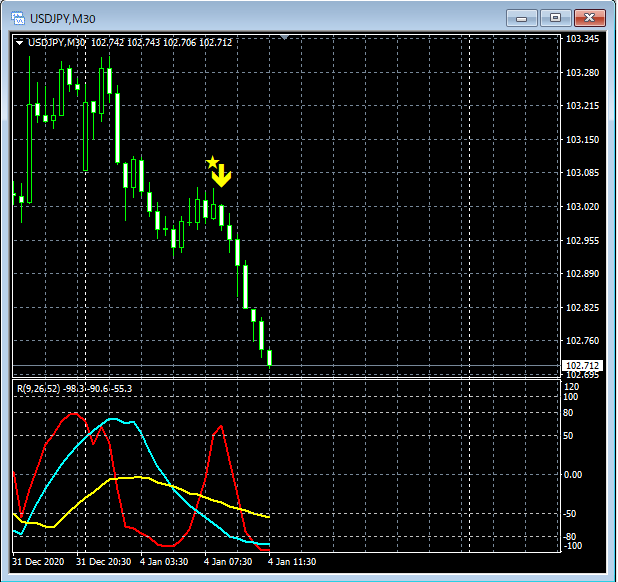
Below, from January 4 to January 8, we pick and introduce examples where the mBDSR (RCI two-line filter version) signals appear to have functioned well.
1
2
3
4
5
6
7
8
9
10
11
12
13
14
15
16
17
18
19
20
21
22
23
24
25
26
27
28
29
30
31
32
33
34
35
Indicator that works best in combination with RCI: BODSOR/mBDSR
https://www.gogojungle.co.jp/tools/indicators/11836
※ An indicator developed to improve entry accuracy when using three RCI lines for buy-the-dip or sell-the-rallies.
The bonus PDF file contains 150 items.Most of them are examples that have been compiled to logically link higher and lower timeframes using three RCI lines, gradually considering multiple lower timeframes and ultimately waiting for the timing to buy on dips or sell on rallies on the lower timeframe (i.e., the mBDSR signal).They aredescribed as being compiled from cases where the higher- and lower-timeframe linkage using the three RCI lines leads to a sequence of assessments of several sub-timeframes, culminating in the timing for dip buying or rally selling on the lower timeframe (the mBDSR signal).more than 550 chartsThe explanation uses.


