

Indicator that gains power when combined with the RCI3 single line; examples of signals observed from December 14 to December 18 (Part 1)
Indicator that demonstrates power when used in combination with RCI【BODSOR・mBDSR】
https://www.gogojungle.co.jp/tools/indicators/11836
※ An indicator developed to improve entry accuracy when using three RCI lines for buying on pullbacks or selling on rallies
The bonus PDF file comes with 150 items.Many of them are examples that logically link higher and lower timeframes using the three RCI lines, examine the conditions of multiple lower-timeframe charts sequentially, and finally arrive at the timing to buy on pullbacks or sell on rallies on the lower timeframe (i.e., signals of mBDSR).They are summarized as such. The explanation usesover 550 charts.
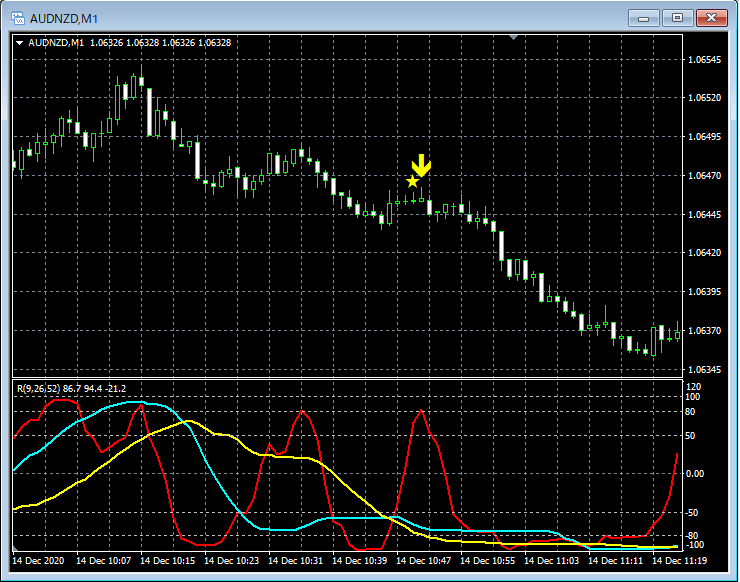
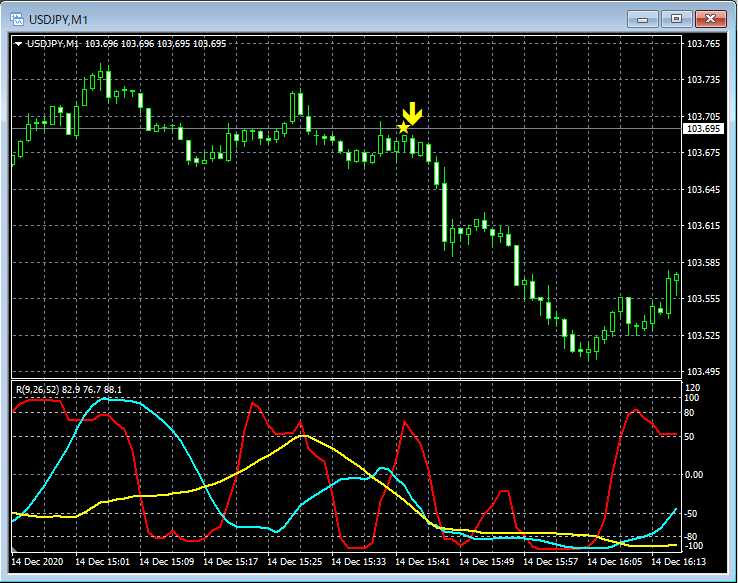
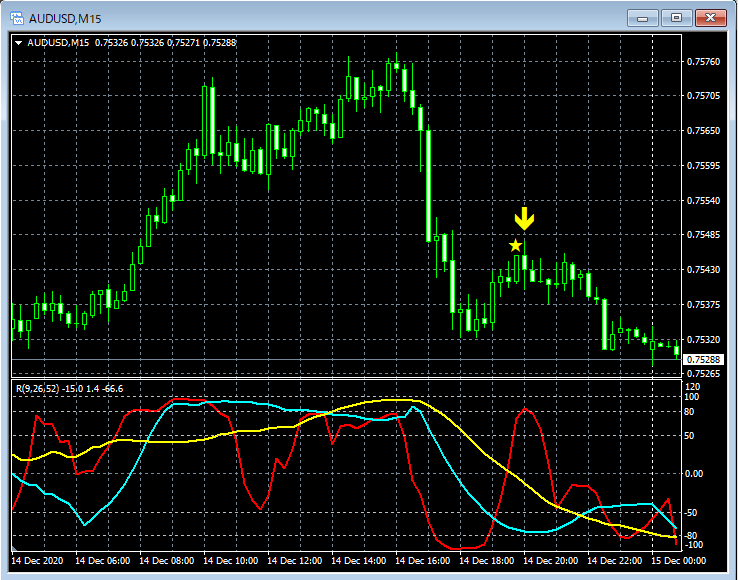
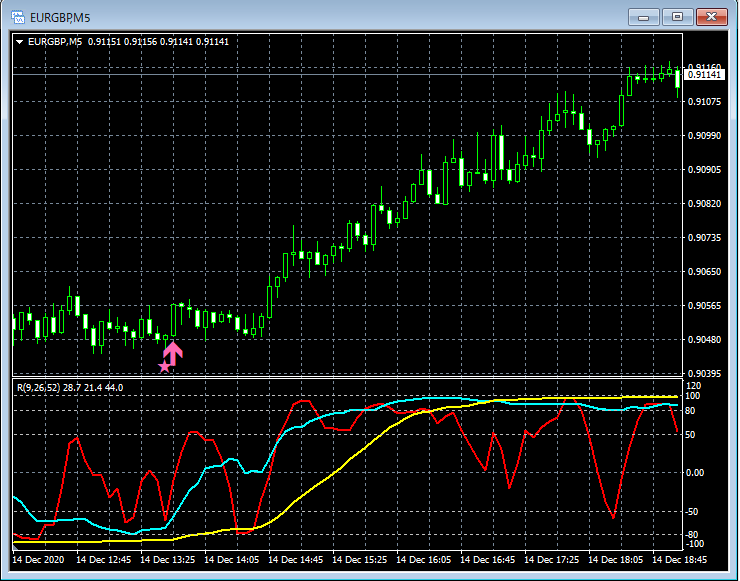
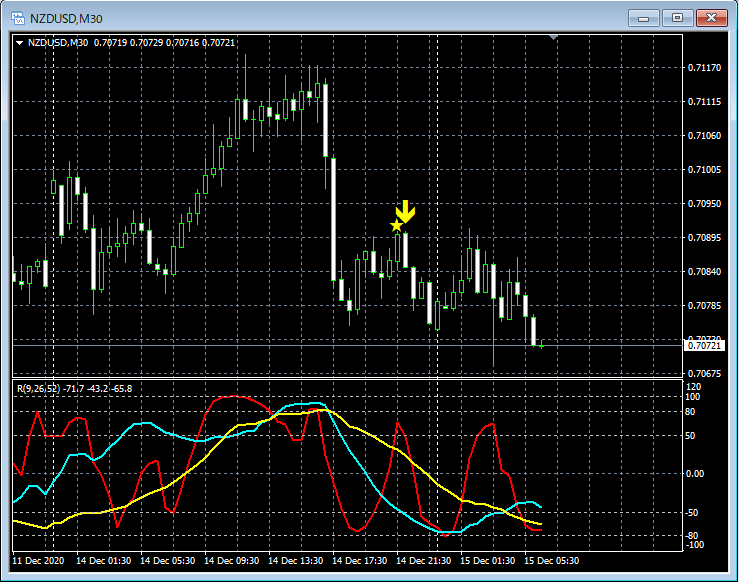
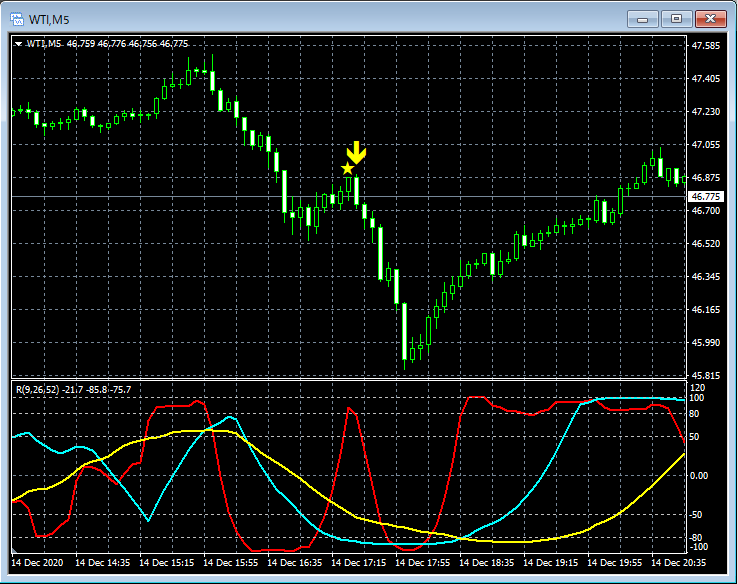
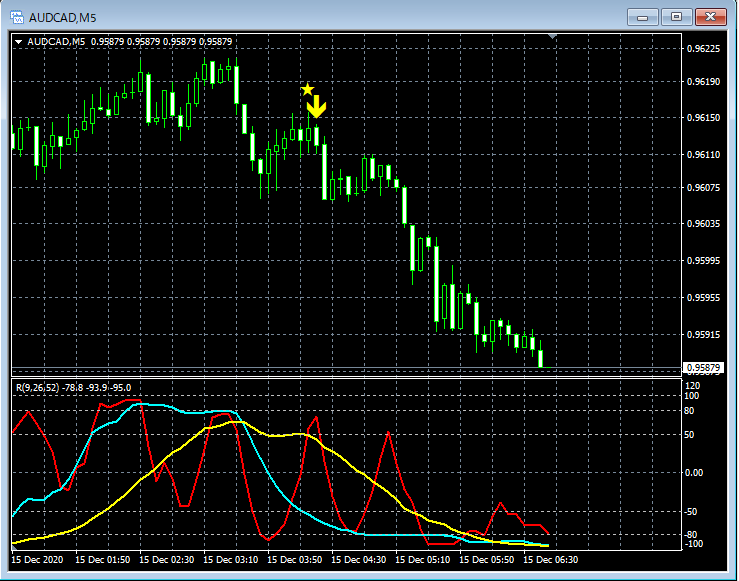
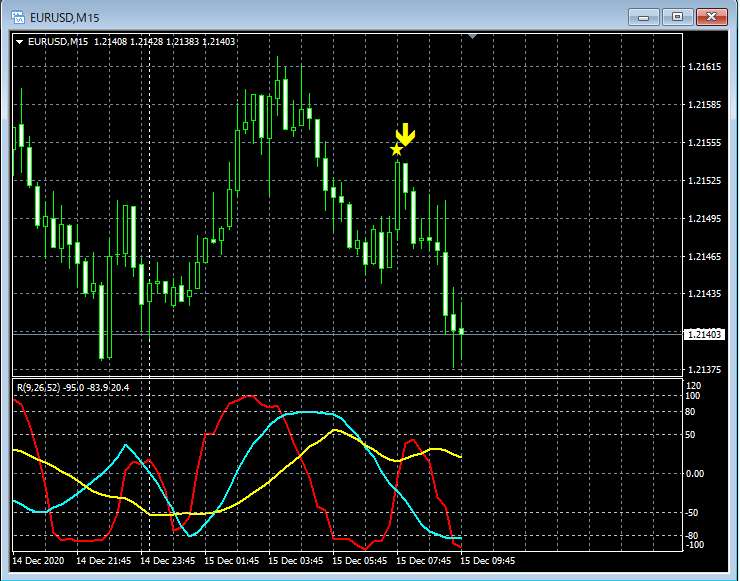
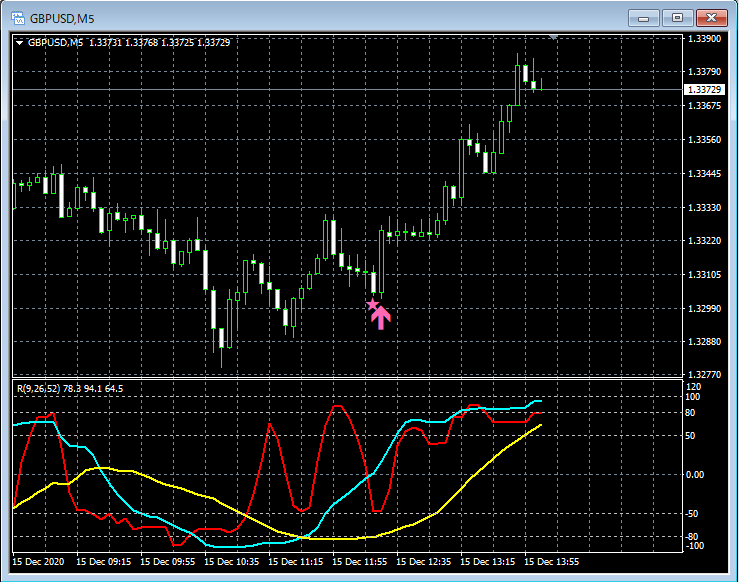
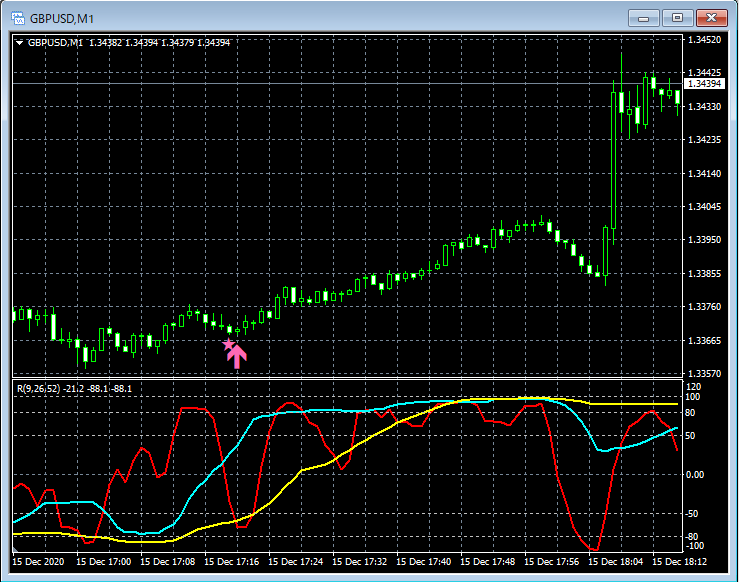
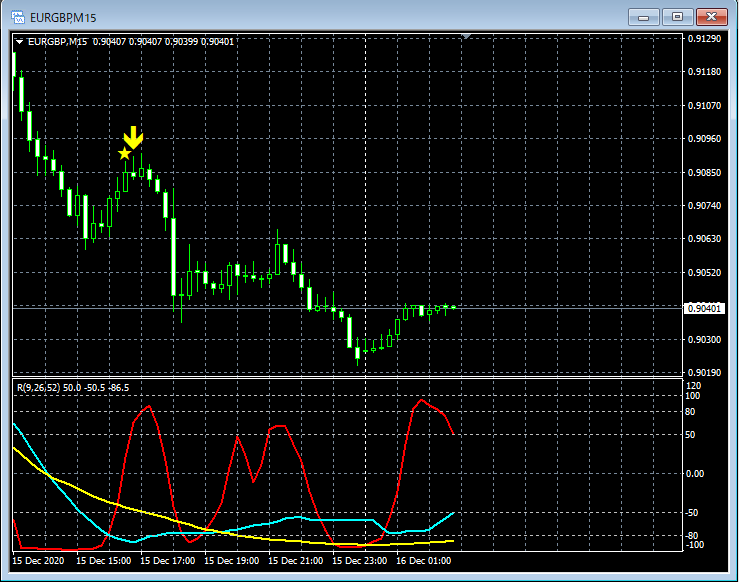
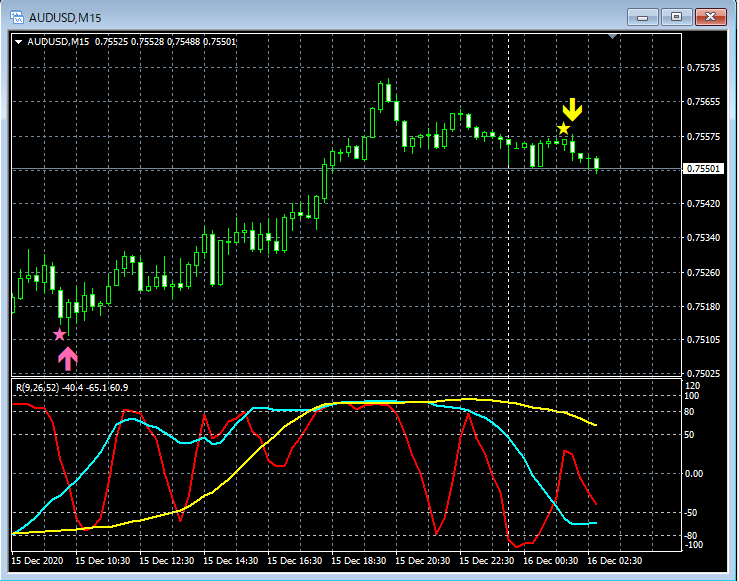
From December 14 to December 18, we selected examples where signals of mBDSR (RCI two-line filter version) seemed to function well and will present them in two parts. This article is the first part.
01
02
03
04
05
06
07
08
09
10
11
12
13
14
Indicator that demonstrates power when used in combination with RCI【BODSOR・mBDSR】
https://www.gogojungle.co.jp/tools/indicators/11836
※ An indicator developed to improve entry accuracy when using three RCI lines for buying on pullbacks or selling on rallies
The bonus PDF file comes with 150 items.Many of them areexamples that logically link higher and lower timeframes using the three RCI lines, examine the conditions of multiple lower-timeframe charts sequentially, and finally arrive at the timing to buy on pullbacks or sell on rallies on the lower timeframe (i.e., signals of mBDSR).They are summarized as such. The explanation usesover 550 charts.


