

Pattern commonly seen on a drop from the RCI2 double top — from today's USD/JPY chart —
Indicator that operates powerfully in combination with RCI: BODSOR・mBDSR
https://www.gogojungle.co.jp/tools/indicators/11836
※ An indicator developed to improve entry accuracy when using three RCI lines for buying on dips or selling on rallies
USD/JPY 15-minute chart
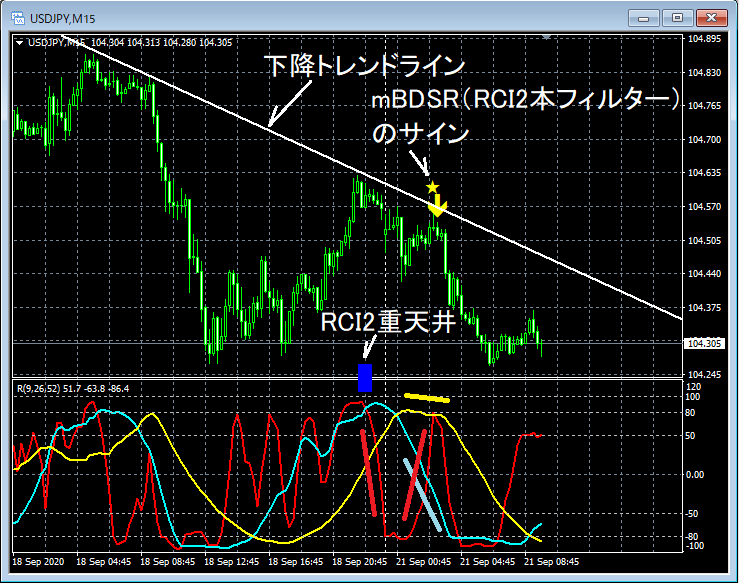
Upper: mBDSR signals (filter: RCI26 and RCI52), descending trend line
Lower: RCI three-line
Around the blue square, RCI9 and RCI26 rise to the top area, rising into a so-called double-top shape of RCI
After that, on the rebound from the temporary drop of RCI9, both RCI26 and RCI52 turn downward
And, in a situation where only RCI9 among the three RCI lines is clearly rising, the mBDSR rebound-sell signal lights up
Immediately after the rebound-sell signal lights up, a bearish candle forms, and the price continues to fall thereafter
※ Please note that some charts introduced in this article may include additions such as circles, straight lines, or rectangles for explanatory convenience.
Indicator that operates powerfully in combination with RCI: BODSOR・mBDSR
https://www.gogojungle.co.jp/tools/indicators/11836
※ An indicator developed to improve entry accuracy when using three RCI lines for buying on dips or selling on rallies


