

Pattern often seen on the downside from the RCI3 double top – from recent NZDJPY chart –
Indicator that shines when combined with RCI: [BODSOR・mBDSR]
https://www.gogojungle.co.jp/tools/indicators/11836
*An indicator developed to improve entry accuracy when using three RCI lines for bullish pullbacks and bearish retracements.
NZDJPY 15-minute chart
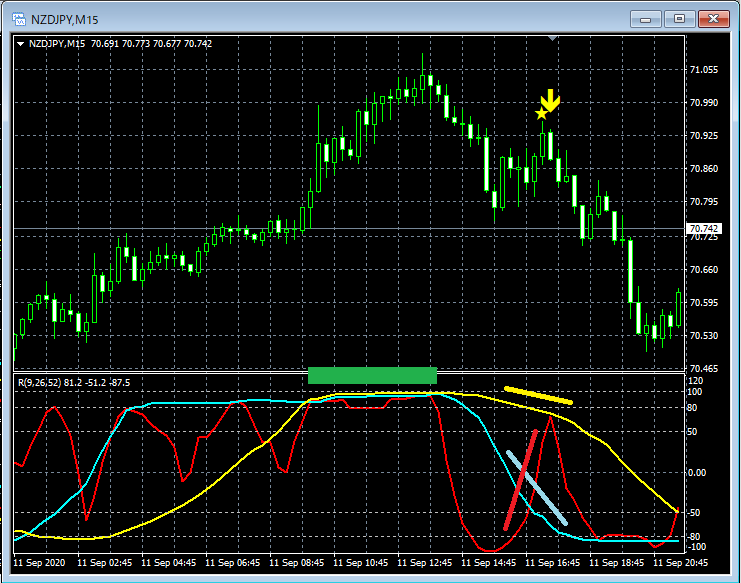
Top panel: mBDSR signal (Filter: RCI26 and RCI52)
Bottom panel: RCI three-line
From the so-called RCI triple-top pattern, when RCI9 temporarily drops and then retraces, both RCI26 and RCI52 turn clearly downward.
In the situation where only RCI9 among the three RCI lines is clearly rising, the mBDSR pullback sell signal lights up.
Before the signal lights up, there is a bullish candle. Right after the signal lights up, two consecutive bearish candles follow, continuing the down move.
NZDJPY 4-hour chart
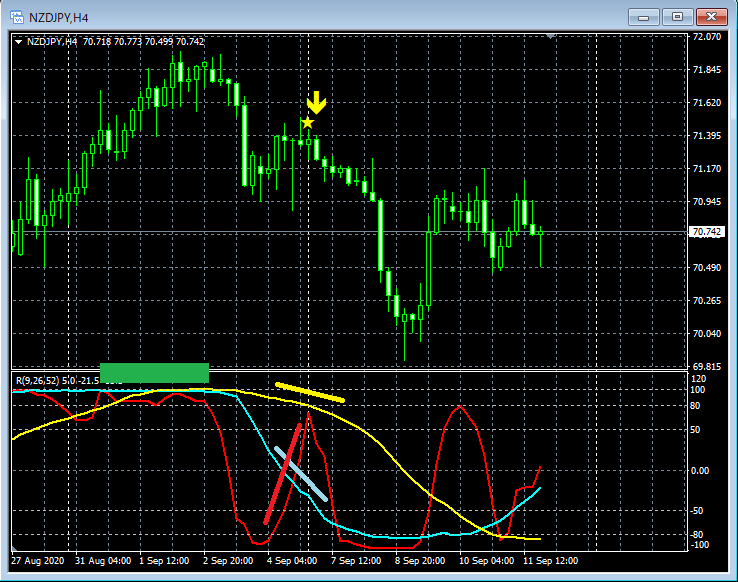
Top panel: mBDSR signal (Filter: RCI26 and RCI52)
Bottom panel: RCI three-line
From the so-called RCI triple-top pattern, when RCI9 temporarily drops and then retraces, both RCI26 and RCI52 turn clearly downward.
In the situation where only RCI9 among the three RCI lines is clearly rising, the mBDSR pullback sell signal lights up.
Before the signal lights up, there is a bullish candle. Right after the signal lights up, three consecutive bearish candles follow, continuing the down move.
NZDJPY daily chart
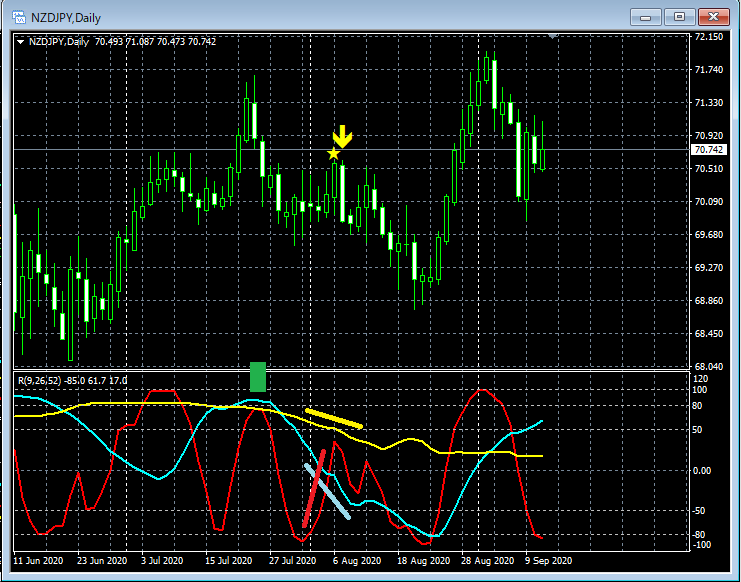
Top panel: mBDSR signal (Filter: RCI26 and RCI52)
Bottom panel: RCI three-line
The positions of RCI9 and RCI52 are a little lower, but they rise toward a shape close to the so-called RCI triple-top. Thereafter, when RCI9 temporarily drops and retraces, both RCI26 and RCI52 turn clearly downward.
In the situation where only RCI9 among the three RCI lines is clearly rising, the mBDSR pullback sell signal lights up.
Before the signal lights up, there is a bullish candle. Right after the signal lights up, two consecutive bearish candles follow, continuing the down move.
*Please note that in the charts introduced in this article, for convenience in explanation, there may be additions such as circles, straight lines, or squares.
Indicator that shines when combined with RCI: [BODSOR・mBDSR]
https://www.gogojungle.co.jp/tools/indicators/11836
*An indicator developed to improve entry accuracy when using three RCI lines for bullish pullbacks and bearish retracements.


