

Recent USD/JPY trend (RCI three-line setup + mBDSR signals)
Indicator that shines in combination with RCI: BODSOR・mBDSR
https://www.gogojungle.co.jp/tools/indicators/11836
※ An indicator developed to improve entry accuracy when using three RCI lines for pullback buying or pullback selling
USD/JPY Daily Chart
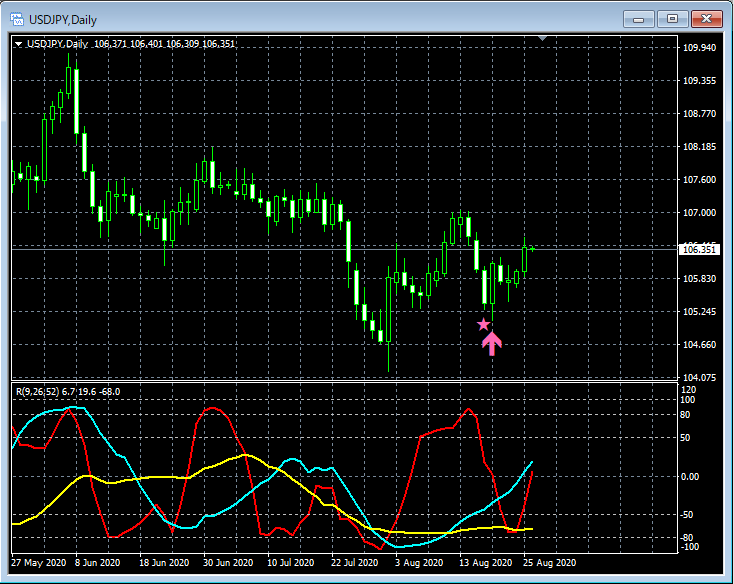
Top: mBDSR (Filter: RCI26 and RCI52)
Bottom: RCI Three-Line (RCI9, RCI26, RCI52)
On the daily chart, a rising arrow sign for mBDSR (filter: RCI26 and RCI52) lit up a few days ago. Right after the sign lit, there was a solid bullish candlestick, and it continued to rise slightly thereafter.
USD/JPY 1-Hour Chart
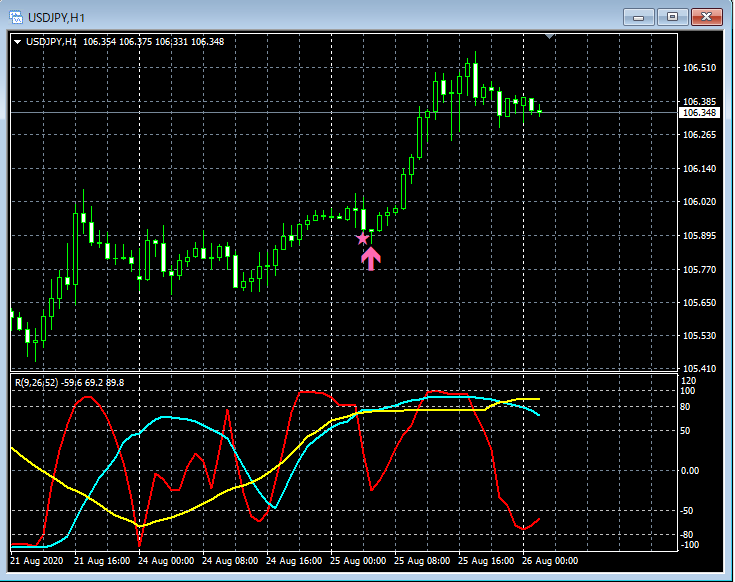
Top: mBDSR (Filter: RCI26 and RCI52)
Bottom: RCI Three-Line (RCI9, RCI26, RCI52)
On the 1-hour chart, yesterday the rising arrow sign for mBDSR (filter: RCI26 and RCI52) lit up. Although the sign initially appeared as a small bearish candle, it was followed by eight consecutive bullish candles, continuing the rise.
In the above example, the rising arrow sign of mBDSR (filter: RCI26 and RCI52) can be considered a well-timed pullback-buy signal.
USD/JPY 1-Hour Chart
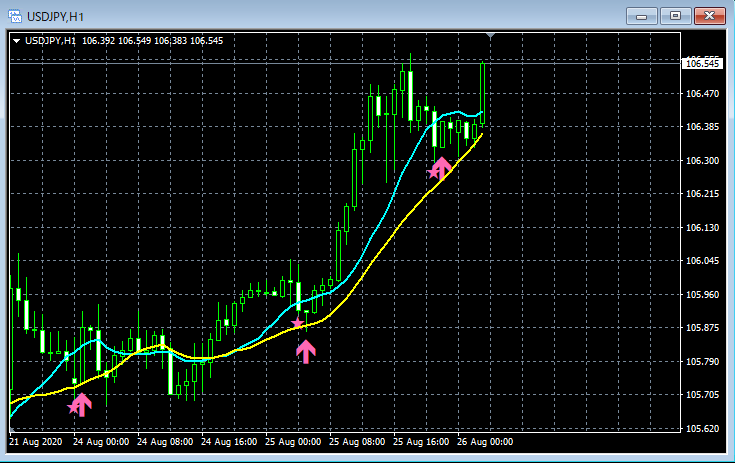
Top: mBDSR (Filter: Two Moving Averages)
Bottom: RCI Three-Line (RCI9, RCI26, RCI52)
Above is the upward arrow sign of the moving-average-filtered version of mBDSR.
In this example as well, the upward arrow sign in the moving-average-filtered version can be considered a well-timed pullback-buy signal.
Indicator that shines with the combination of RCI: BODSOR・mBDSR
https://www.gogojungle.co.jp/tools/indicators/11836
※ An indicator developed to improve entry accuracy when using three RCI lines for pullback buying or pullback selling


