

Example of the sign for the “Moving Average Filter Version of mBDSR”
Indicator that shows its power when used in combination with RCI: BODSOR・mBDSR
https://www.gogojungle.co.jp/tools/indicators/11836
This indicator was developed to improve entry accuracy when using three RCI lines to buy on dips or sell on rebounds.
Below are examples of signals from the recent USD/CHF weekly, daily, and 4-hour charts using the “mBDSR Moving Average Filter Version.”
USD/CHF Weekly
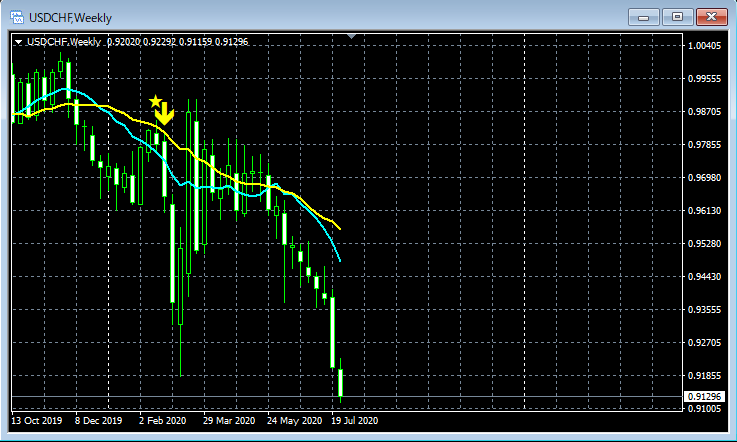
Right after the signal lights up, two large bearish candles occur and the price drops sharply.
USD/CHF Daily
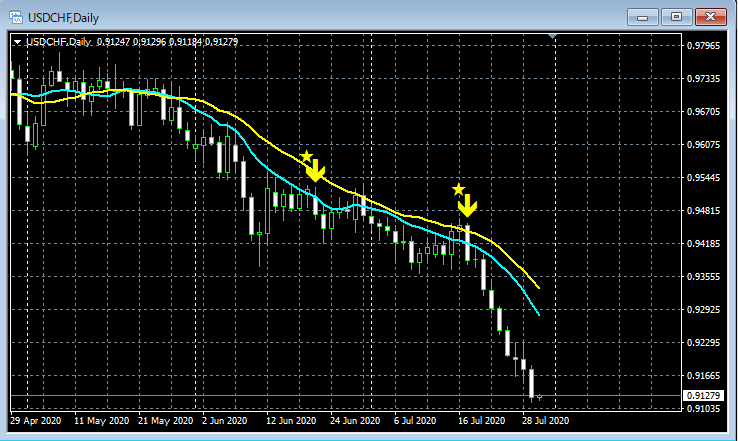
First signal: before the signal lights up, there is a bullish candle, and immediately afterward there are two consecutive bearish candles.
Second signal: before the signal lights up, there is a bullish candle, and immediately afterward there is a bearish candle followed by a sharp drop.
USD/CHF 4-Hour
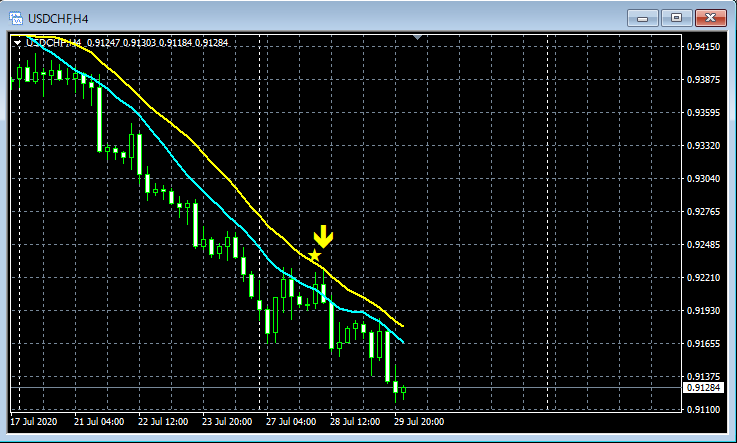
Before the signal lights up there is a bullish candle, and afterward there are consecutive bearish candles and prices continue to fall.
Indicator that shines when used in combination with RCI: BODSOR・mBDSR
https://www.gogojungle.co.jp/tools/indicators/11836
This indicator was developed to improve entry accuracy when using three RCI lines to buy on dips or sell on rebounds.
× ![]()


