RCI-related indicators 【RCIBT】 and 【mBDSR】: practical usage examples
MT4 indicator that alerts the threefold RCI tops ( bottoms ), twofold tops ( bottoms ), and tops ( bottoms): RCIBT
https://www.gogojungle.co.jp/tools/indicators/22204
An indicator that shines in combination with RCI: BODSOR and mBDSR
https://www.gogojungle.co.jp/tools/indicators/11836
The chart below displays the following two indicators
[RCIBT2] (included in [RCIBT])
[mBDSR_2RCI] (included in [BODSOR・mBDSR])
on the most recent EURJPY 1-hour chart.
Note: Indicators that display three RCI lines are not included in the two products above, so please be aware.
EURJPY 1-hour
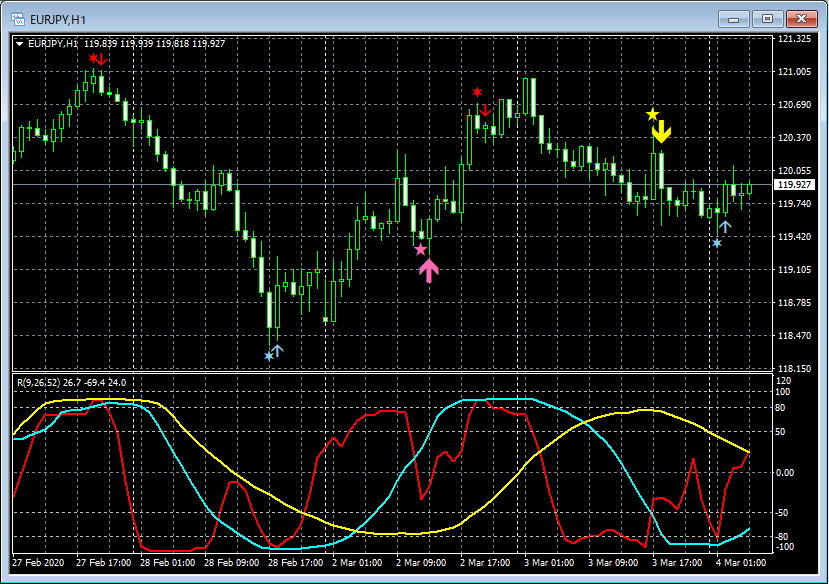
Top row: signals from [RCIBT2] and [mBDSR_2RCI]
Bottom row: RCI three lines (red: RCI9, light blue: RCI26, yellow: RCI52)
As shown above, these indicators display star marks and arrows together, but if you find both displays too noisy, you can set the display position of the arrows (stars) farther away to show only the stars (arrows).
The chart below shows only the stars for [RCIBT2].
EURJPY 1-hour
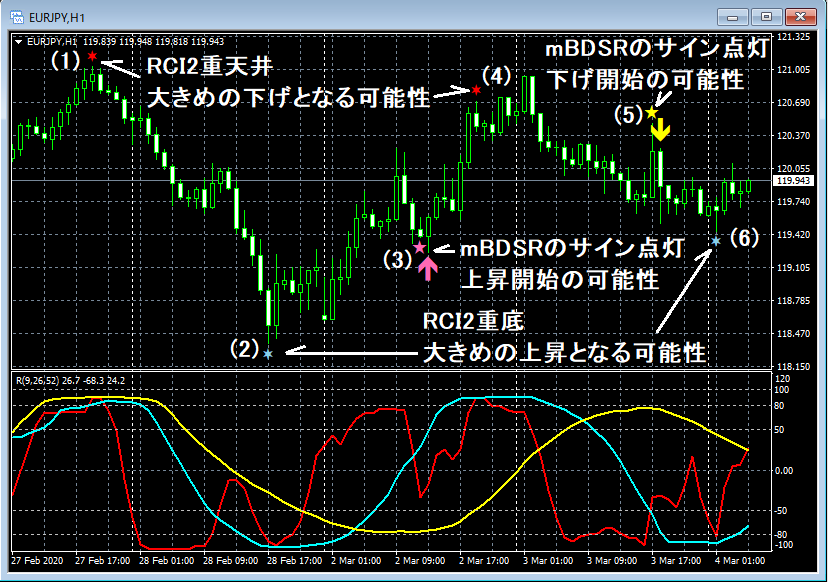
Top row: signals from [RCIBT2] and [mBDSR_2RCI]
Bottom row: RCI three lines (red: RCI9, light blue: RCI26, yellow: RCI52)
(1) Signal from [RCIBT2]
So-called RCI double top.
Possibility of a sizable decline.
In this example, the decline started just after the signal lit.
(2) Signal from [RCIBT2]
So-called RCI double bottom.
Possibility of a sizable rise.
In this example, the rise started just after the signal lit.
(3) Signal from [mBDSR_2RCI]
Downward signal from mBDSR lights up, suggesting a possible resumption of upward movement from here.
In this example, just before the signal lit there was a bearish candle, immediately after the signal there were consecutive bullish candles, and it continued to rise. This shows a very well-timed signal.
(4) Signal from [RCIBT2]
So-called RCI double top.
Even after the signal lights, the price keeps making new highs, but it may be acceptable as a profit-taking point for the signal in (3) [mBDSR_2RCI].
(5) Signal from [mBDSR_2RCI]
Downward signal from mBDSR lights up, suggesting a possible resumption of decline from here.
In this example, just before the signal lit there were bullish candles, immediately after the signal there were consecutive bearish candles, and it continued to fall. This demonstrates a very well-timed signal.
(6) Signal from [RCIBT2]
So-called RCI double bottom.
Right after the signal lights, a solid bullish candle forms and the price does not drop to a new low thereafter. (This may be a good profit-taking point for the signal in (5) [mBDSR_2RCI].)
Thus, displaying the two indicators above can significantly improve chart clarity.
MT4 indicator that alerts the threefold RCI tops ( bottoms ), twofold tops ( bottoms ), and tops ( bottoms): RCIBT
https://www.gogojungle.co.jp/tools/indicators/22204

An indicator that shines in combination with RCI: BODSOR and mBDSR
https://www.gogojungle.co.jp/tools/indicators/11836