

This week's sign example for "RCI three-line + mBDSR" (November 11 to November 15)
0
Indicator that shines in combination with RCI: BODSOR・mBDSR
https://www.gogojungle.co.jp/tools/indicators/11836
* An indicator developed to improve entry accuracy when using three-line RCI for buying on pullbacks or selling on pullbacks.
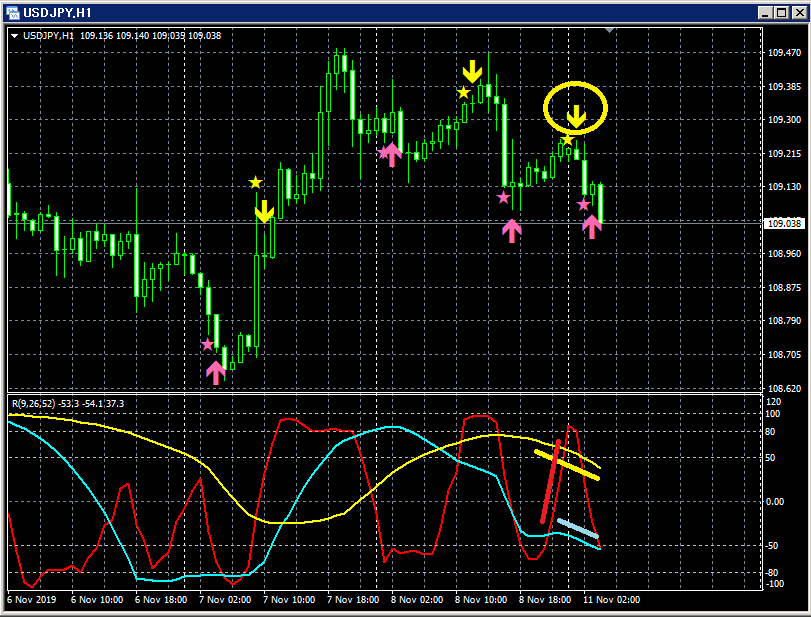
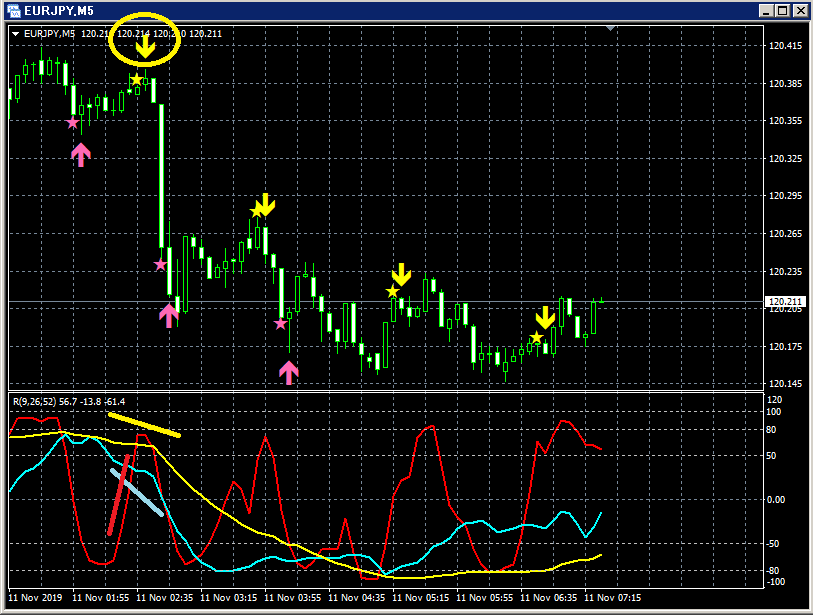
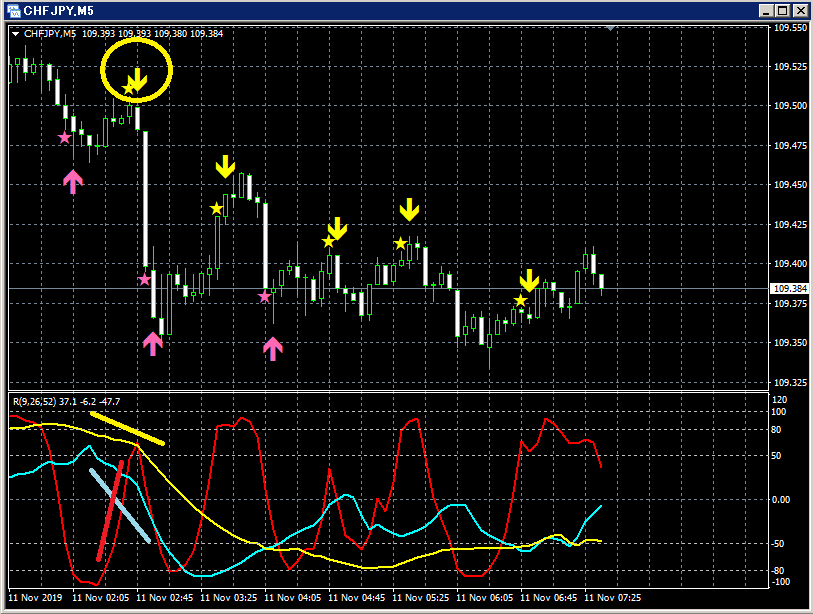
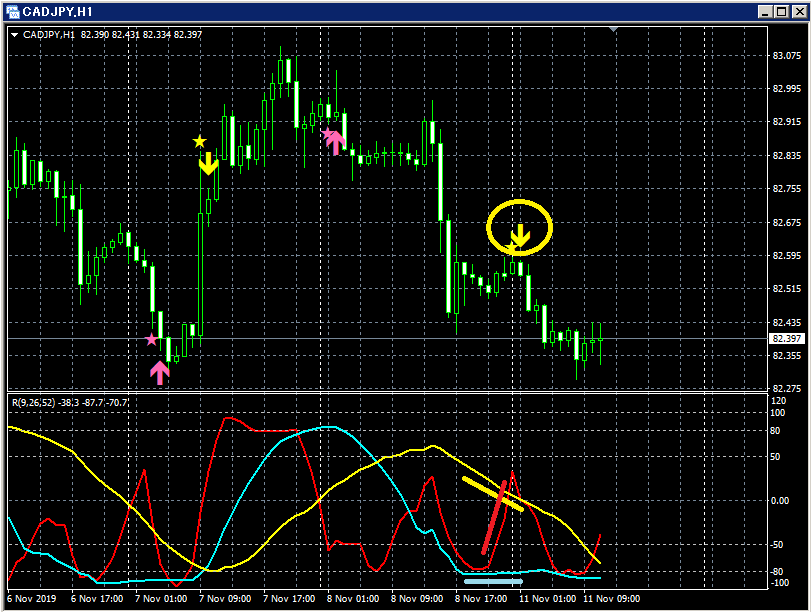
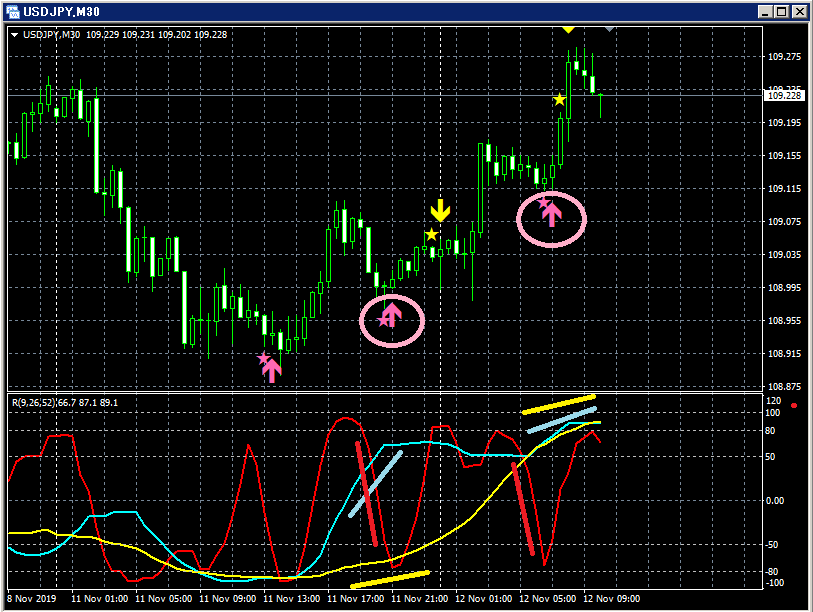
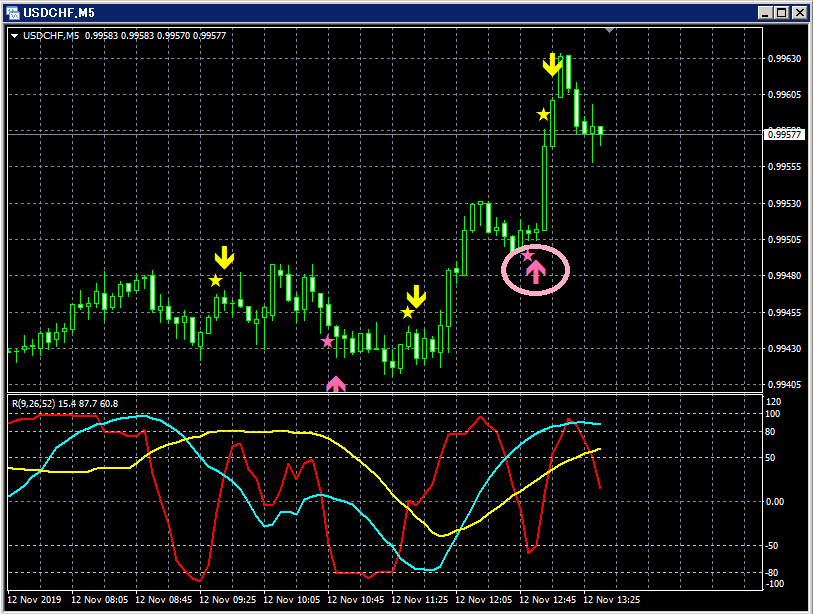
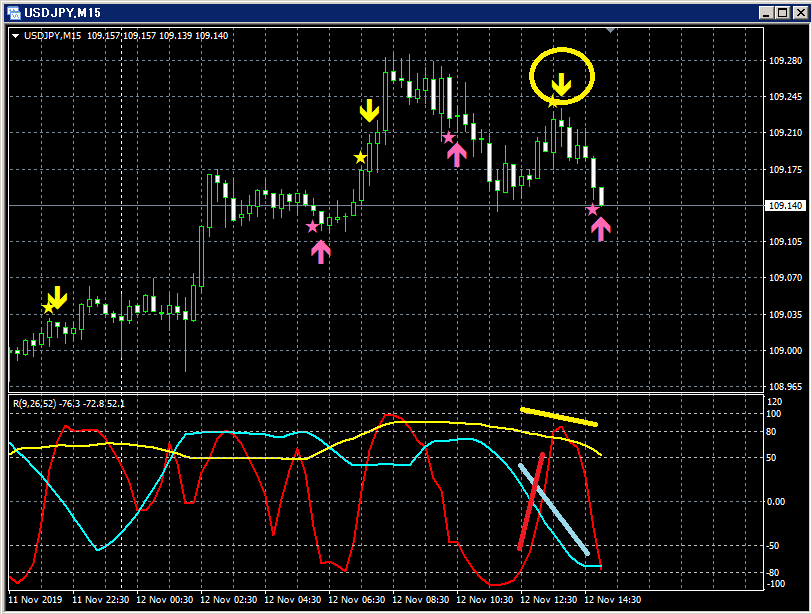
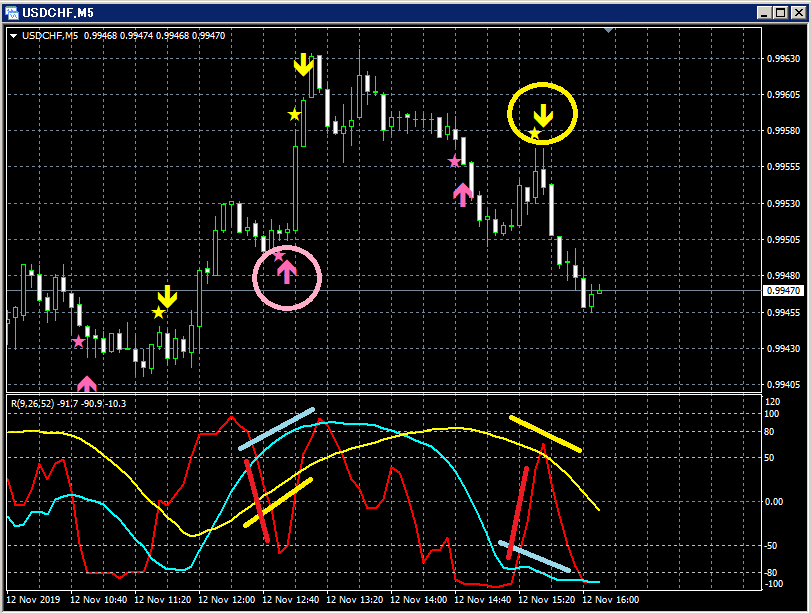
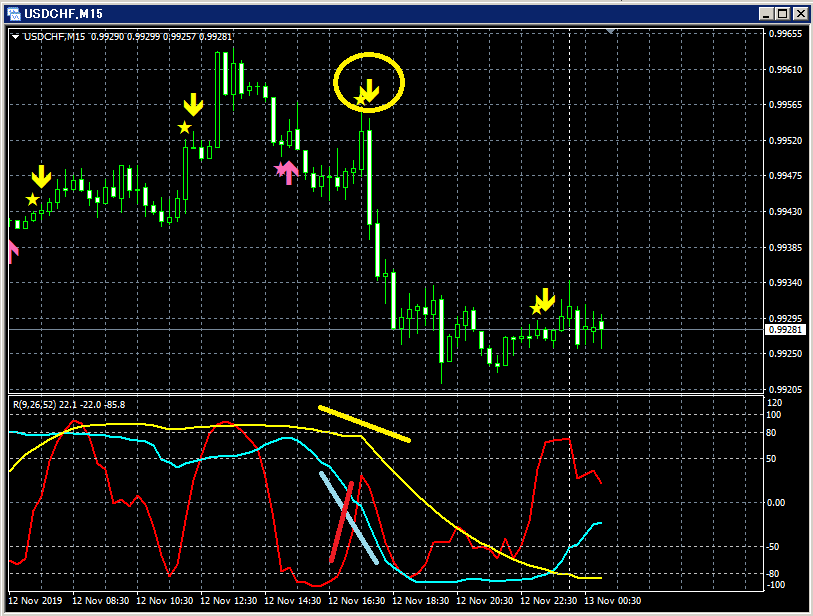
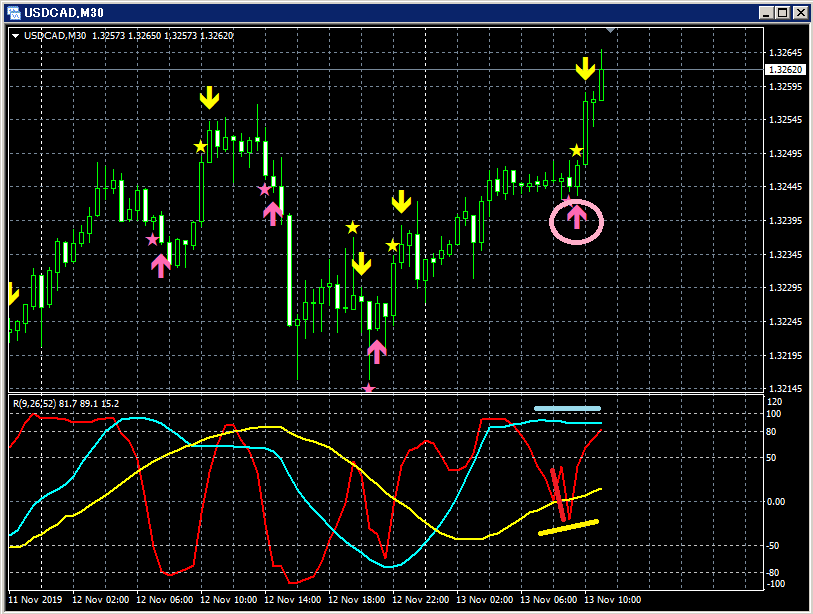
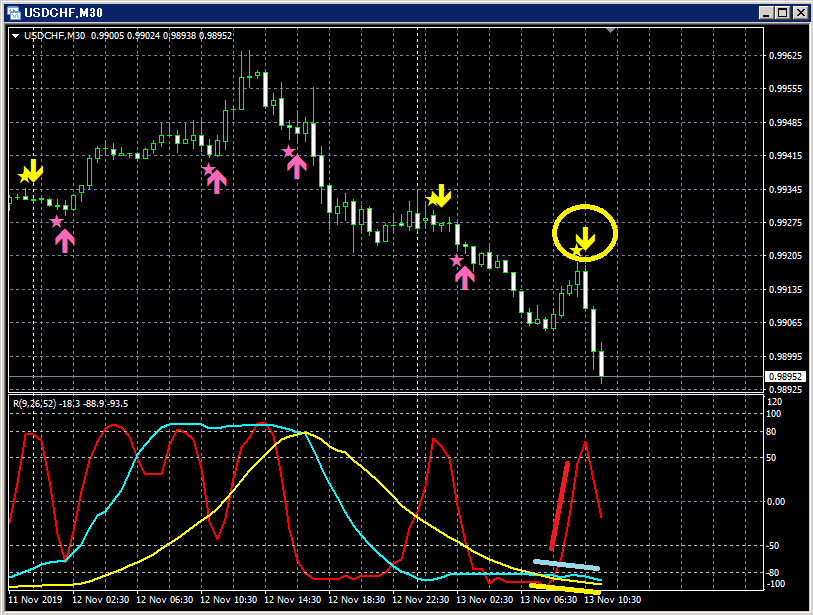
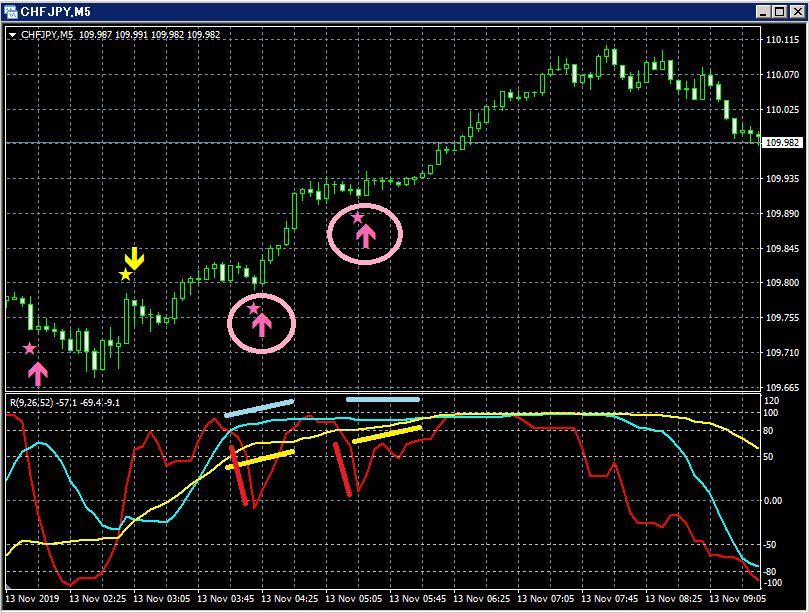
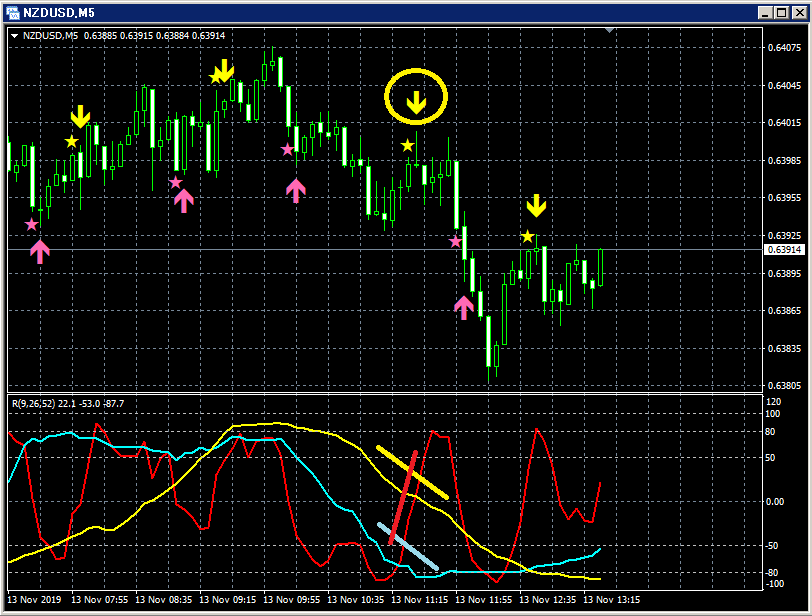
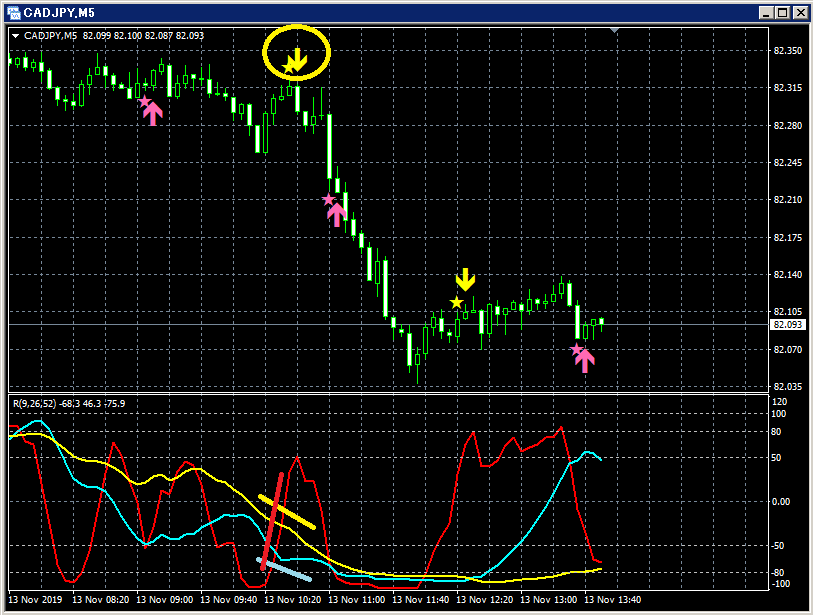
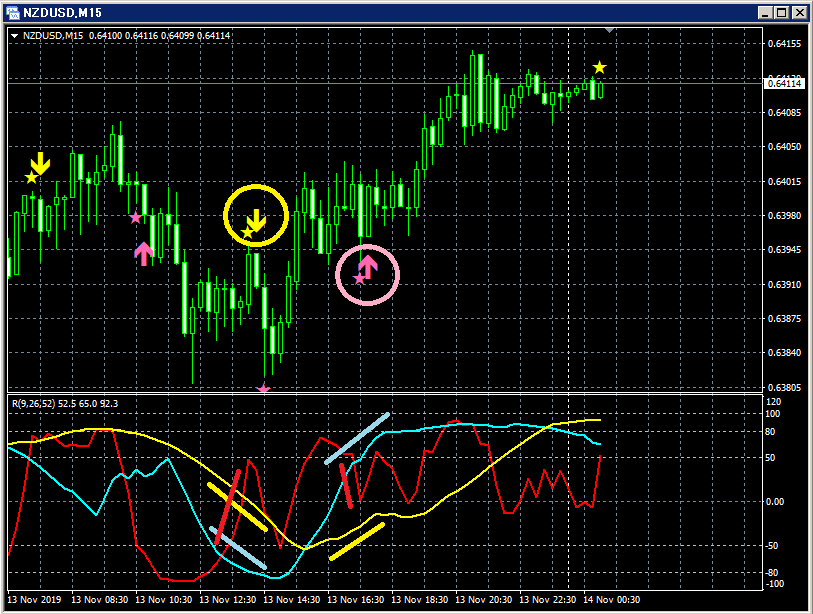
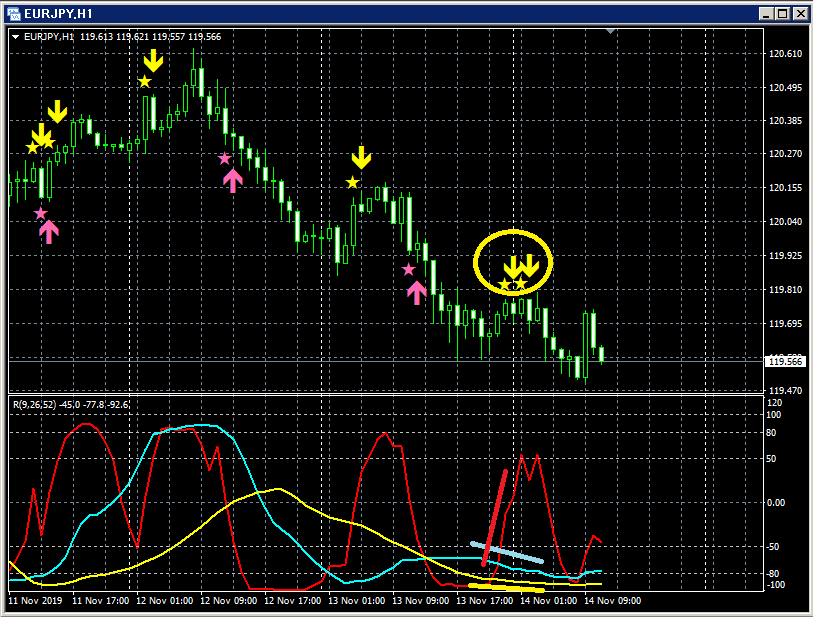
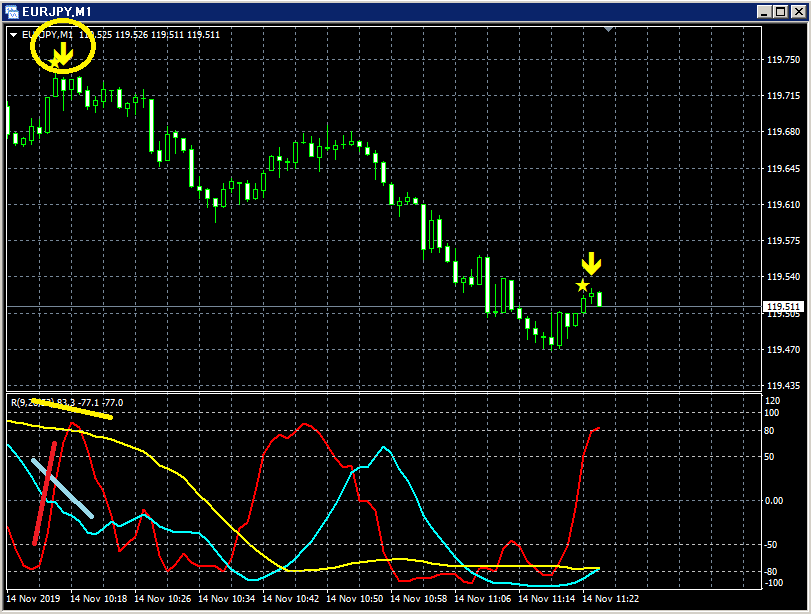
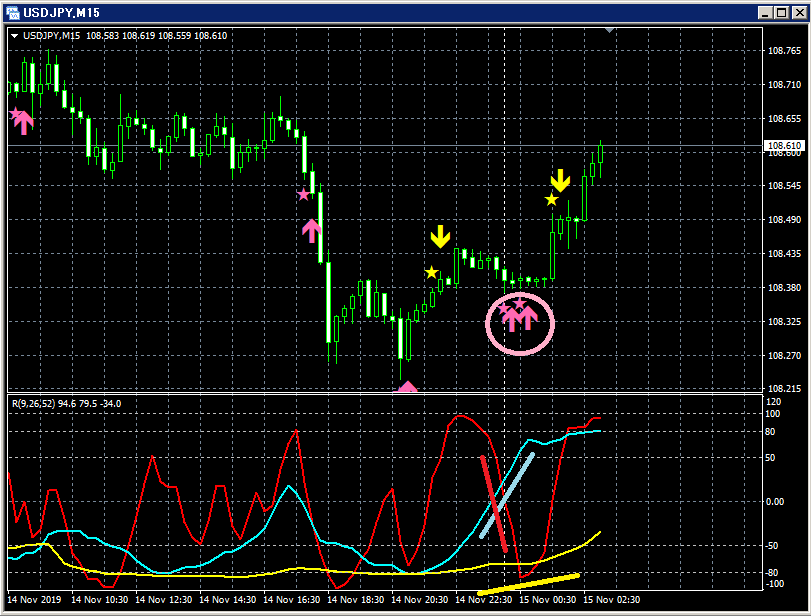
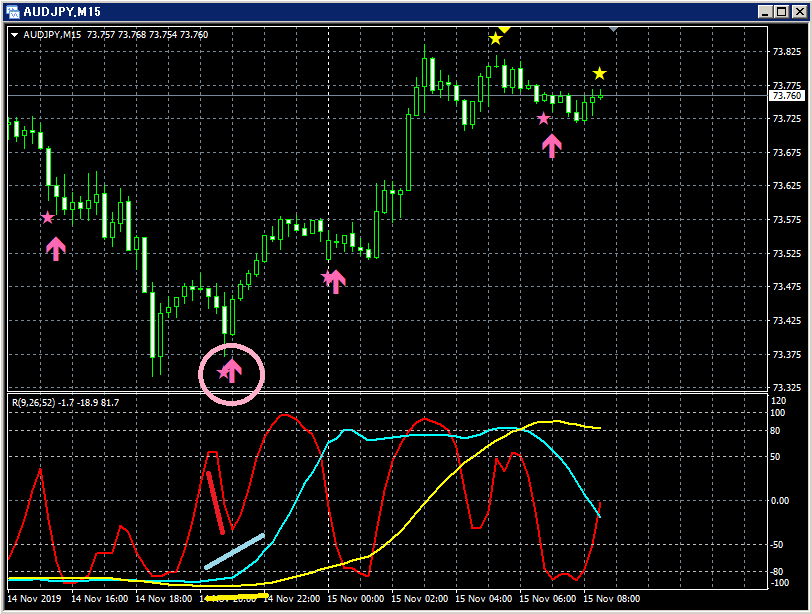
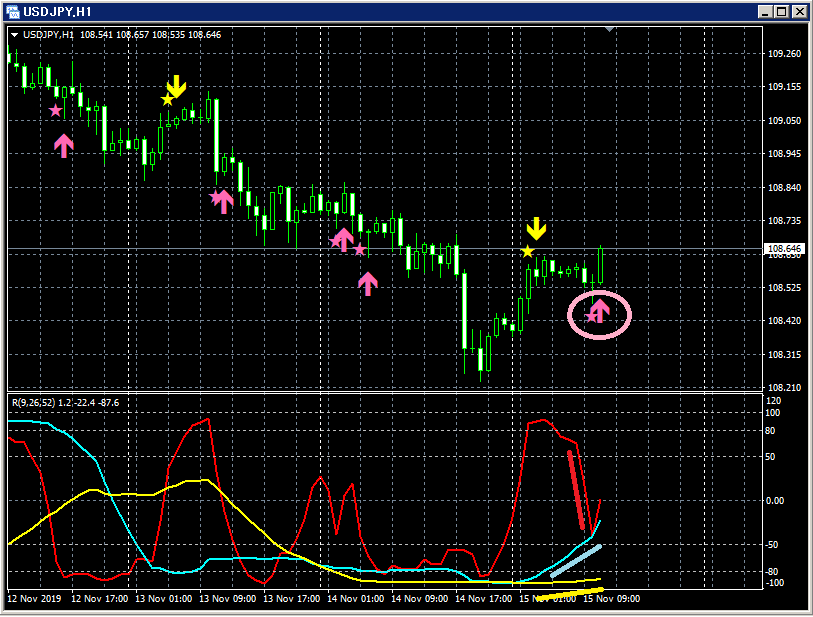
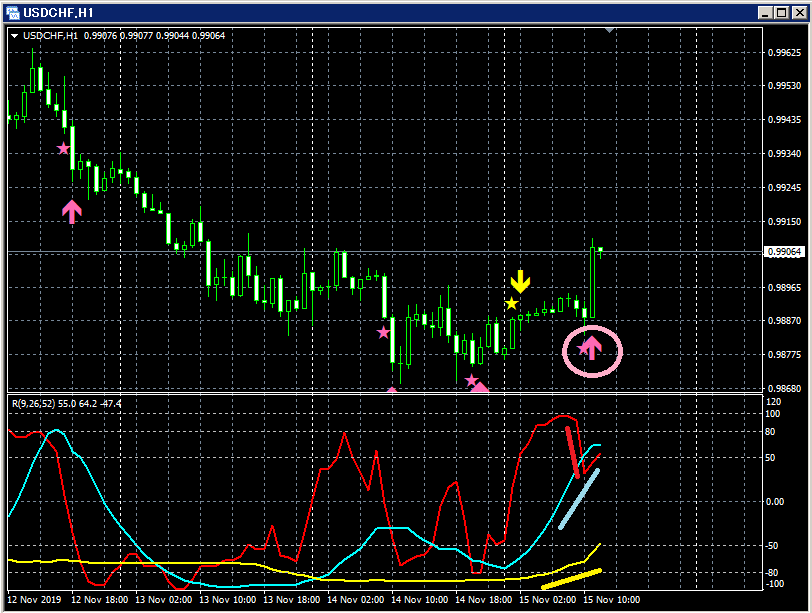
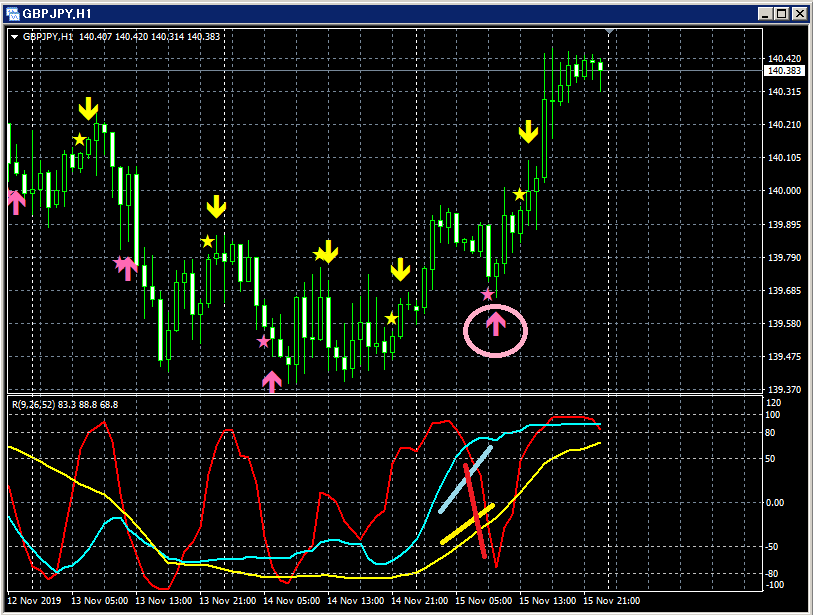
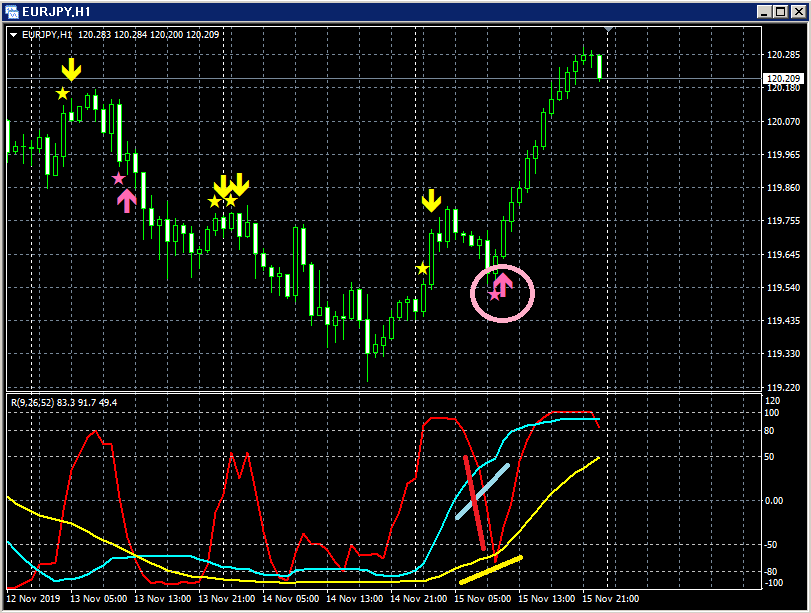
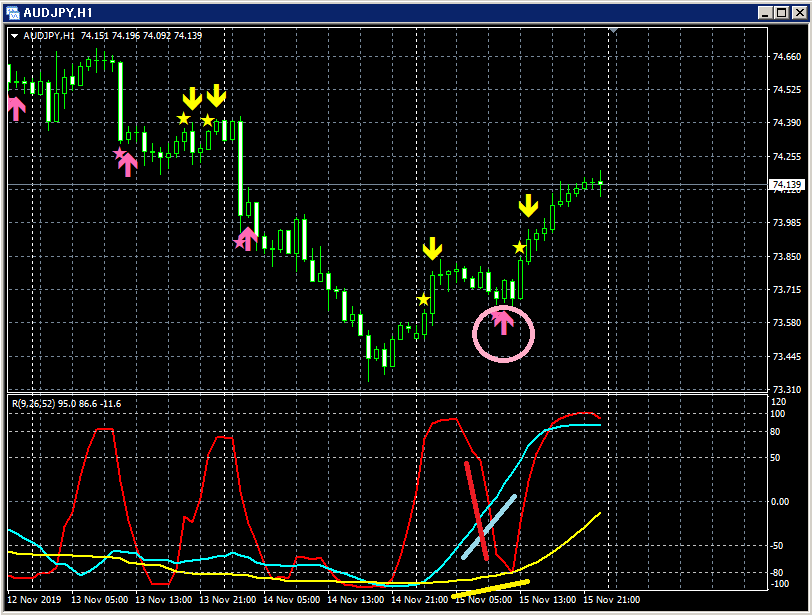
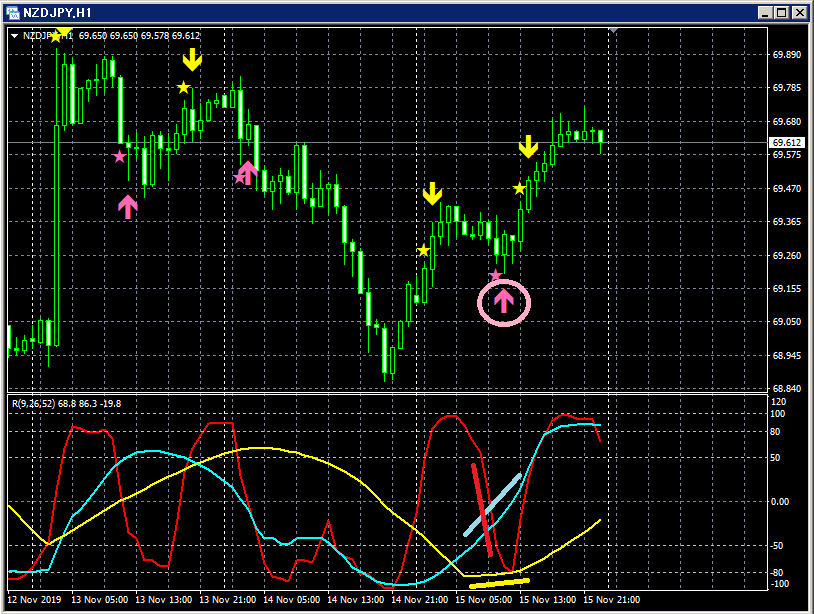
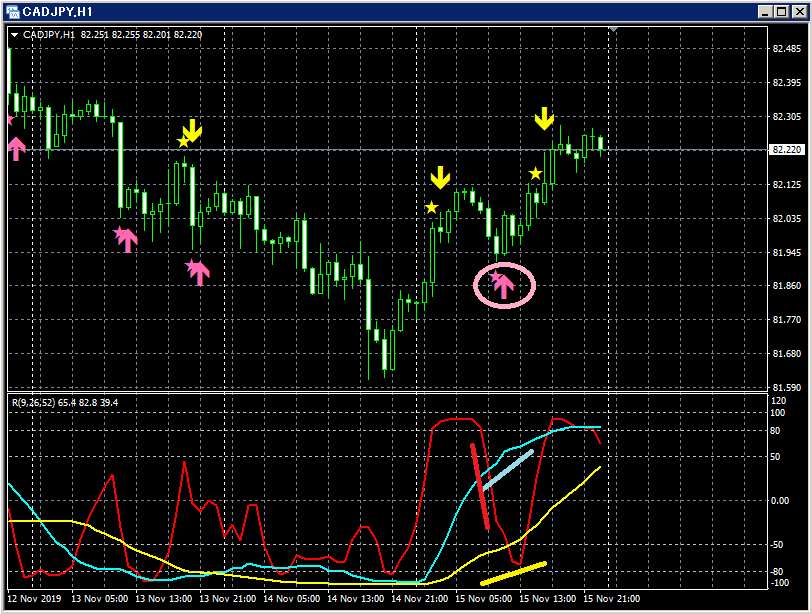
The figure below shows examples of signals from this week (November 11 to November 15) of “RCI three lines + mBDSR.”
There is no strict definition for the “RCI three lines + mBDSR signals,” but the basic idea is as follows.
“RCI three lines + mBDSR Buy on pullback signal”
In the scenario where only RCI9 is clearly declining among the three RCI lines (RCI9, 26, 52), the mBDSR upward arrow lights up.
* When RCI9 reverses upward, all three RCI lines rise together, potentially indicating a strong upward move.
“RCI three lines + mBDSR Sell on pullback signal”
In the scenario where only RCI9 is clearly rising among the three RCI lines (RCI9, 26, 52), the mBDSR downward arrow lights up.
* When RCI9 reverses downward, all three RCI lines decline together, potentially indicating a strong downward move.
01
02
03
04
05
06
07
08
09
10
11
12
13
14
15
16
17
18
19
20
21
22
23
24
25
26
Indicator that shines in combination with RCI: BODSOR・mBDSR
https://www.gogojungle.co.jp/tools/indicators/11836
* An indicator developed to improve entry accuracy when using three-line RCI for buying on pullbacks or selling on pullbacks.
× ![]()


