

[RCI3 Three-Line + mBDSR (mBDSRplus) Method] Dollar-Yen 15-minute chart, 5-minute chart, 1-minute chart
An indicator that shines in combination with RCI: BODSOR・mBDSR
https://www.gogojungle.co.jp/tools/indicators/11836
【mBDSRplus】An indicator that complements mBDSR
※The two indicators above were developed to improve entry accuracy when buying on dips or selling on rallies using three lines of RCI.
to be used for improving entry precision.
Dollar/Yen 15-minute chart (September 27, 2019)
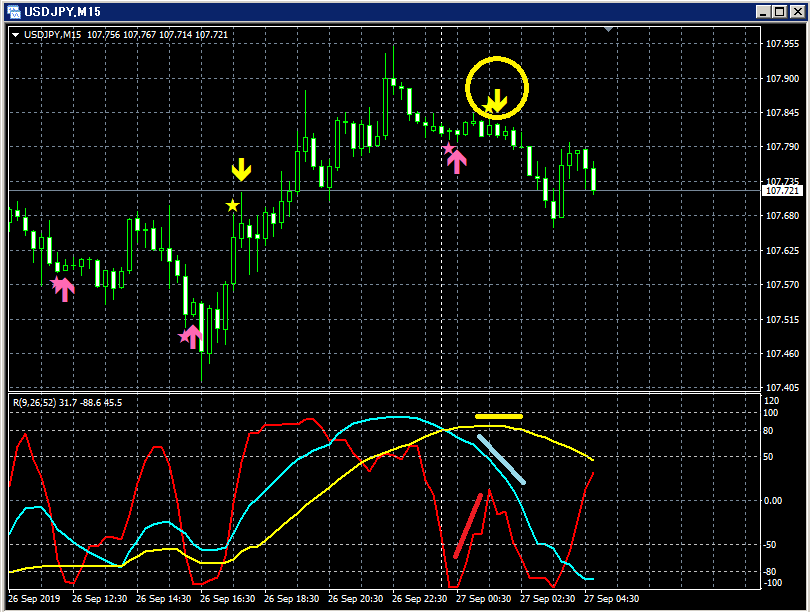
Top row: mBDSR
Bottom row: RCI three-line
Dollar/Yen 5-minute chart (September 27, 2019)
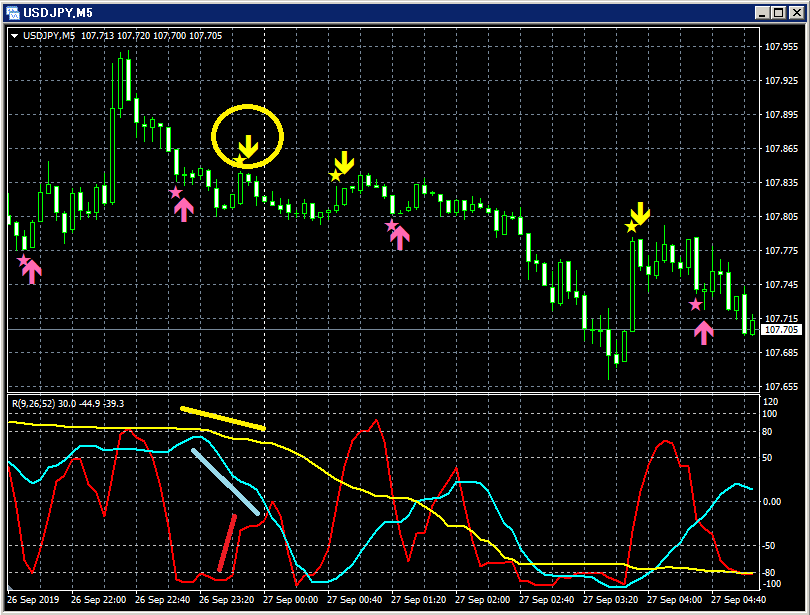
Top row: mBDSR
Bottom row: RCI three-line
Dollar/Yen 1-minute chart (September 27, 2019)
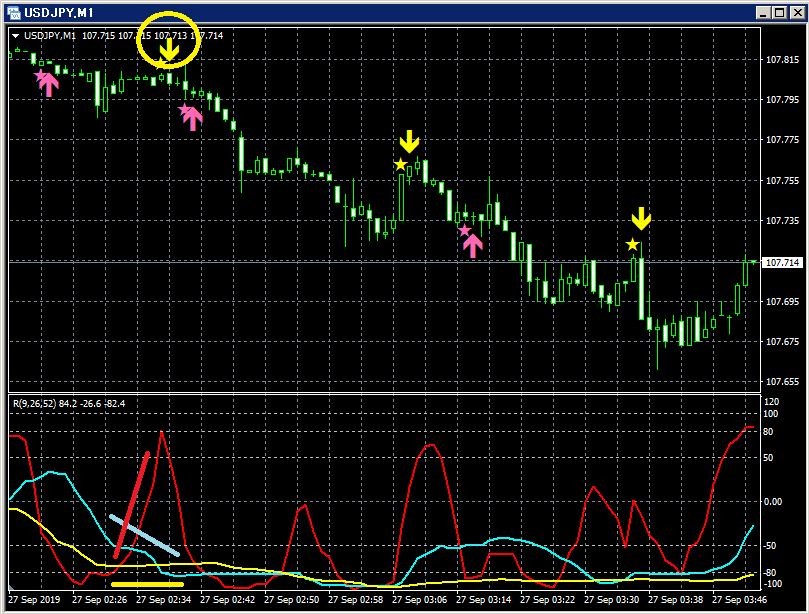
All three of the above cases involve
a decline after the sell signal on the rebound with the “RCI three-line + mBDSR”.
(In a situation where only RCI9 among the RCIs is clearly rising, the downward arrow of mBDSR lights up.)
Dollar/Yen 15-minute chart (September 10, 2019)

Top row: mBDSR, mBDSRplus
Bottom row: RCI three-line
A chance that cannot be captured by mBDSR can sometimes be captured by mBDSRplus.
The decline after the sell signal on the rebound with “RCI three-line + mBDSRplus”.
(In a situation where only RCI9 among the RCIs is clearly rising, the downward arrow of mBDSRplus lights up.)
× ![]()


