

Example of a return-sell signal for "RCI3 Broad Line + mBDSR" – USD/JPY 4-hour chart
Indicator that shows its power when combined with RCI: 【BODSOR・mBDSR】
https://www.gogojungle.co.jp/tools/indicators/11836
*An indicator developed to improve entry accuracy when buying on dips or selling on rallies using three RCI lines
USD/JPY Four-hour chart
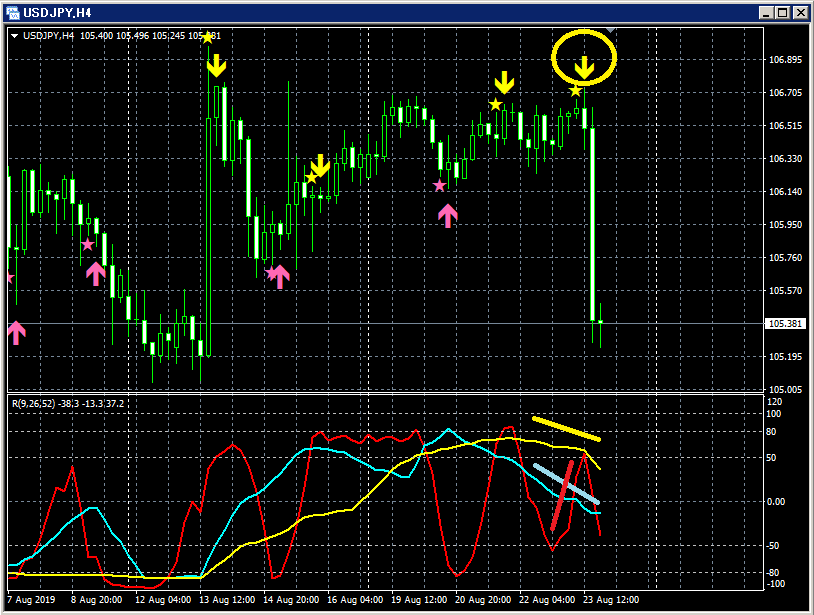
Upper row: mBDSR
Lower row: RCI three lines
Decline after the return-selling signal lights up for “RCI three lines + mBDSR”.
(In a situation where only RCI9 among the three RCI lines is clearly rising, the downward arrow of mBDSR lights up.)
Bearish candles appear consecutively three times immediately after the return-selling signal lights up.
In this case, the candle two bars before the candle that confirms the reversal decline of the descending RCI9 confirms the return-selling signal.
At the point where this is confirmed, the return-selling signal lighting is confirmed.
Indicator that shows its power when combined with RCI: 【BODSOR・mBDSR】
× ![]()


