

Example of a return-sell signal for "RCI3 Three-Line + mBDSR" USD/JPY 5-minute chart
0
Indicator that shows power when used with RCI: 【BODSOR・mBDSR】
https://www.gogojungle.co.jp/tools/indicators/11836
An indicator developed to enhance entry accuracy when using three RCI lines for buy orders on pullbacks or selling on retracements
USD/JPY 5-minute chart
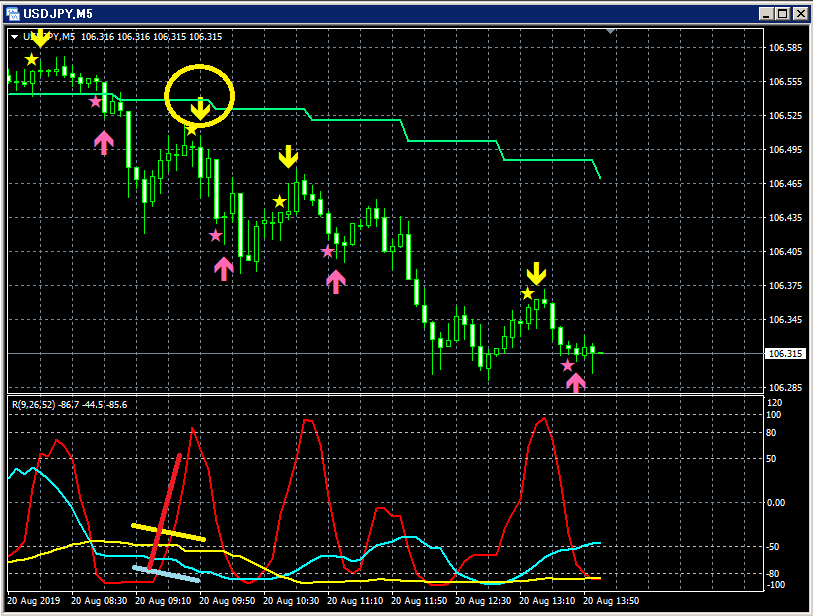
Top: mBDSR
Bottom: RCI three-line
A pullback after clearly breaking the 1-hour EMA21 (green-yellow line), with the pullback of “RCI three-line + mBDSR”
A decline after a sell signal lights up.
(Only RCI9 among the three RCI lines is clearly rising when the downward arrow of mBDSR lights up.)
Immediately after the pullback sell signal lights up, a bearish candlestick appears. Subsequently, the price did not exceed the high of the candle whose signal lit up
and fell.
In this case, the reversal decline of the downward-moving RCI9 is confirmed by the candle immediately before the candle that confirms the signal,
and the pullback sell signal confirmation occurs at that point.
× ![]()


