

Indicator that shines in combination with RCI: 【mBDSR】
0
Indicator that shines when combined with RCI: [BODSOR・mBDSR]
https://www.gogojungle.co.jp/tools/indicators/11836
* An indicator developed to improve entry accuracy when using three-line RCI for pullback buying and pullback selling
NZDUSD 30-minute chart
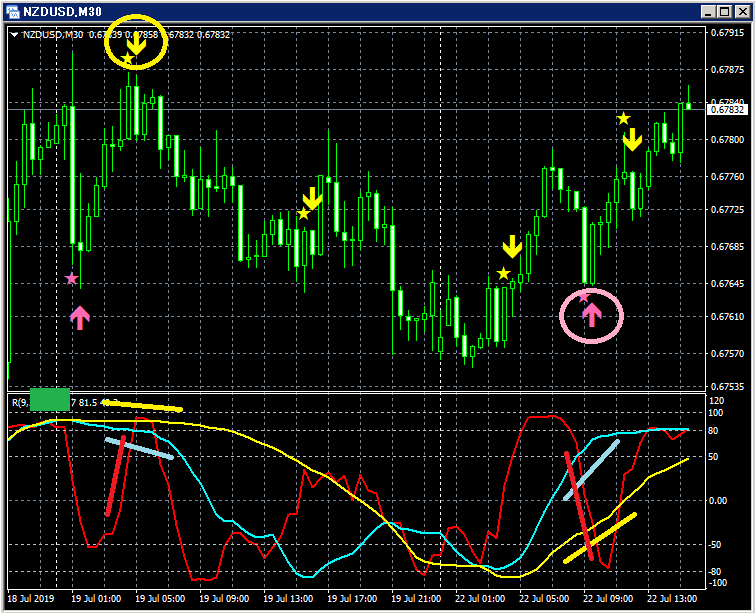
Top row: mBDSR
Bottom row: RCI three lines
(1) Sell-after-pullback signal (yellow downward arrow encircled in yellow)
Drop from the sell signal lighting up after “RCI three lines + mBDSR” pullback signal.
(RCI9 is the only clearly rising line among the RCI three lines, and the downward arrow of mBDSR lights up.)
A common pattern where the signal lights up after RCI resistance breaks from a triple top and then declines and pulls back to rise again.
(2) RCI52 falls to -80 or below
(3) Buy-on-pullback signal (pink downward arrow encircled in pink)
Rise after the pullback signal lights up for “RCI three lines + mBDSR”
(Only RCI9 is clearly declining among the RCI three lines, and the upward arrow of mBDSR lights up.)
× ![]()


