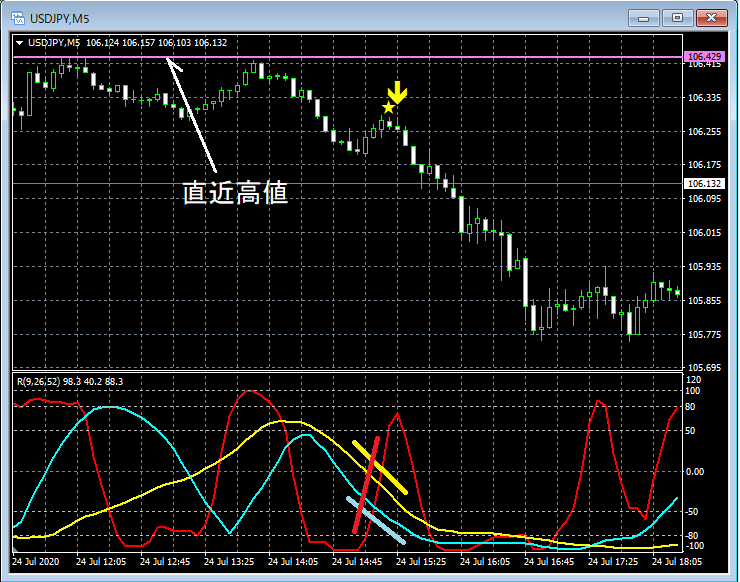

[One trade might break even!?] A method using RCI and mBDSR
0
【 master RCI!! Trend Reversal, Buy on Dips, Sell on Rallies】
An indicator that shines in combination with RCI: 【BODSOR・mBDSR】
and methods and case studies (PDF) ★GogoJungle AWARD2020 winner★
https://www.gogojungle.co.jp/tools/indicators/11836
(1) Development background
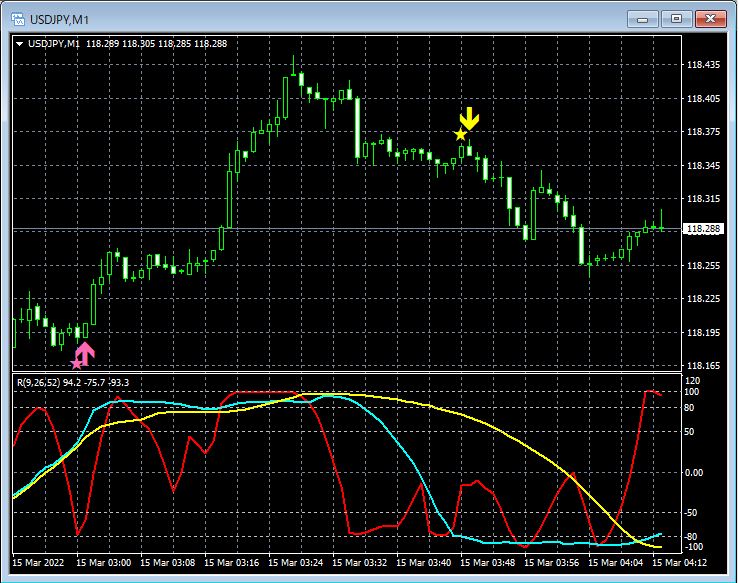
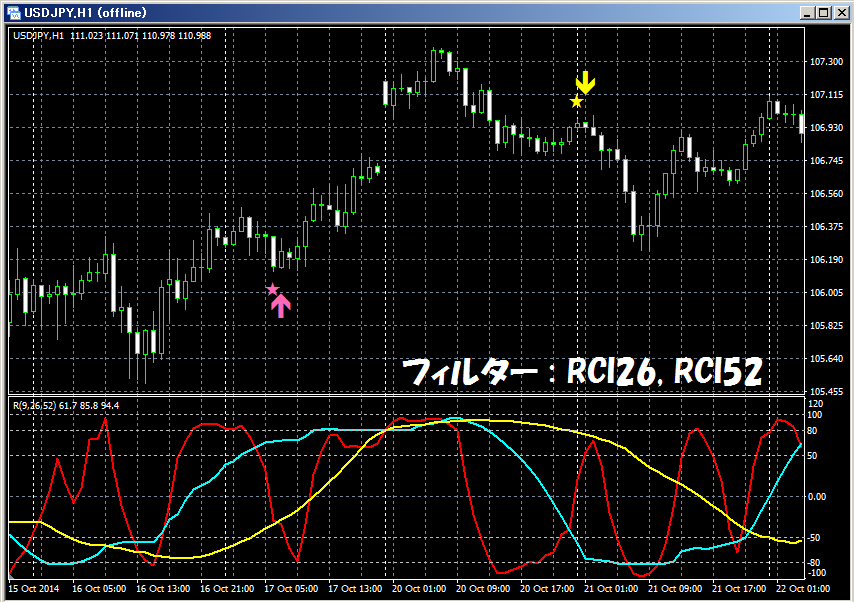
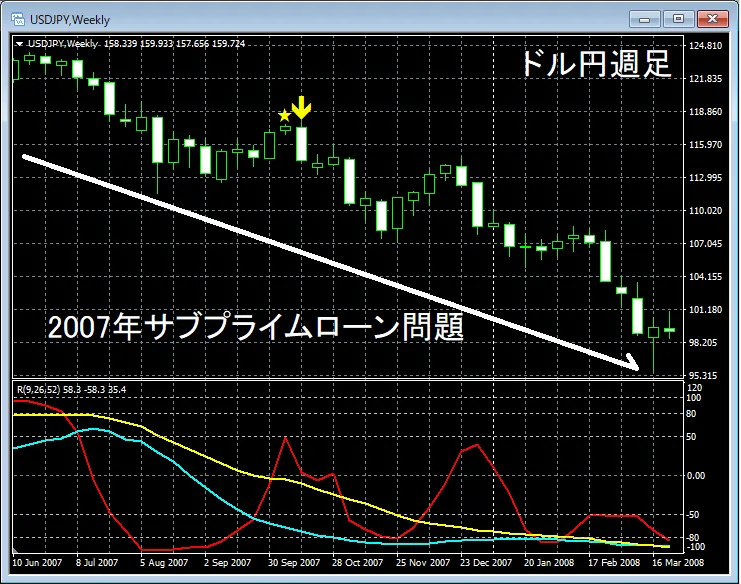
RCI three-linewas studied, and charts from the time of the“Subprime mortgage crisis of 2007” “Lehman Shock of 2008”were examined, leading to the development ofmBDSRan indicator.
The two charts below display the signals of themBDSR (RCI two-line filter)developed later on, on the weekly chart for USDJPY in 2007 and the monthly chart for AUDJPY in 2008.
USDJPY – Dollar/Yen Weekly
AUDJPY – Australian Dollar/Yen Monthly
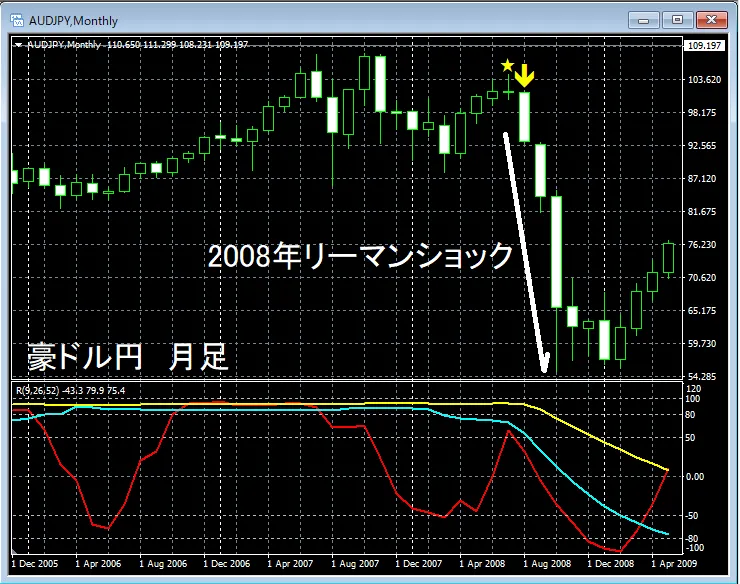
Since its inception, this indicator has been believed to be a highly capable entry tool when combined with“Multi-timeframe analysis”and other methods and environmental awareness.
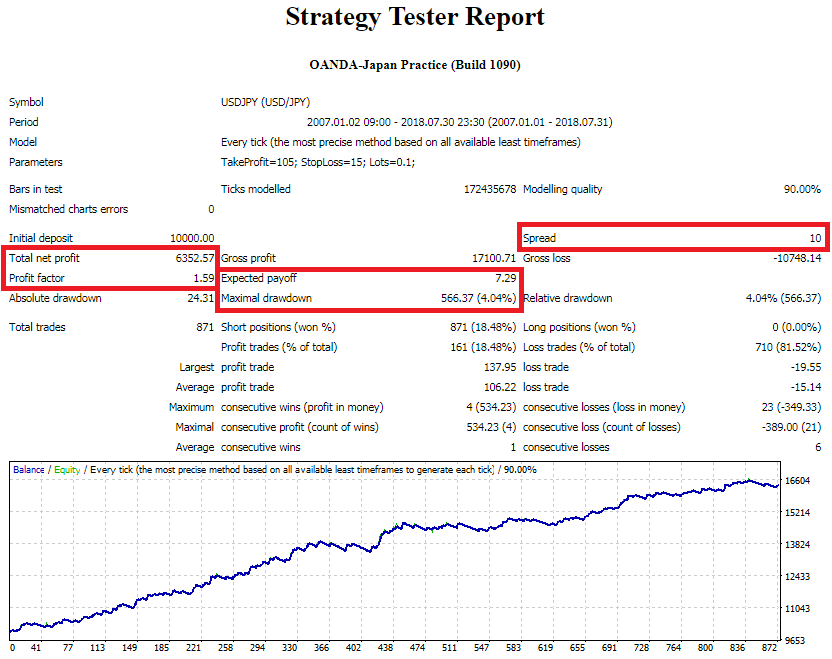
In the backtest example below, even though it did not implement the core technique of“Drilling down from higher to lower timeframes using three RCI lines”and other aspects, the profits increased steadily, indicating the high potential ofmBDSR (RCI two-line filter)as a powerful tool.
Backtest example
Entries using mBDSR (RCI two-line filter) (TP fixed, SL fixed)
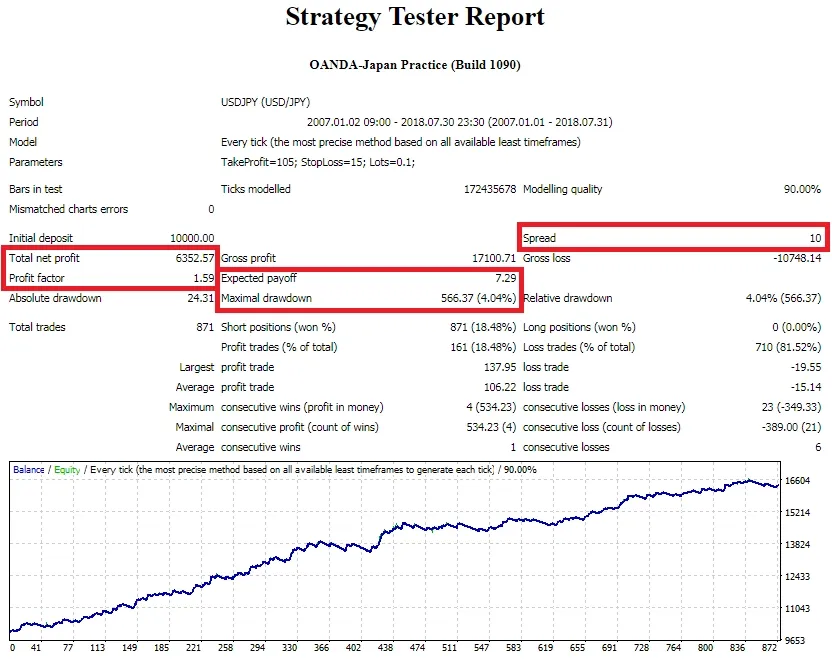
Note: This backtest was conducted solely to illustrate the potential of the indicator. In practice,signals from mBDSR (RCI two-line filter)entries based solely on these are not recommended.
The product was launched in 2017, and since then we have added numerous PDFs that explain“environmental awareness”and“drilling down from higher to lower timeframes using three RCI lines”and other combined methods and case studies.
During this process, we have received the following favorable reviews.
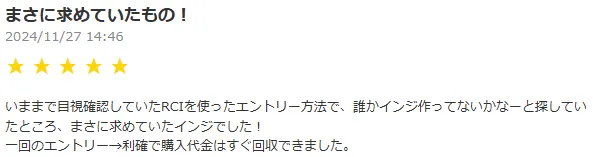
Method using environmental awareness, RCI, and mBDSRmay allow you to break even in a single trade.
Below, we introduce entries aiming for small losses and large profits usingmethods that combine environmental awareness, RCI, and mBDSRto achieve favorable risk/reward.
(2) Environmental awareness and mBDR (RCI two-line filter signals)
Here, in XAUUSD (Gold/US Dollar), we examine an example (case study) where the 4-hour chart (upper timeframe) is watched and the 15-minute chart (lower timeframe) is used towait for mBDSR signalsto appear.
Gold/USD XAUUSD 4-hour chart
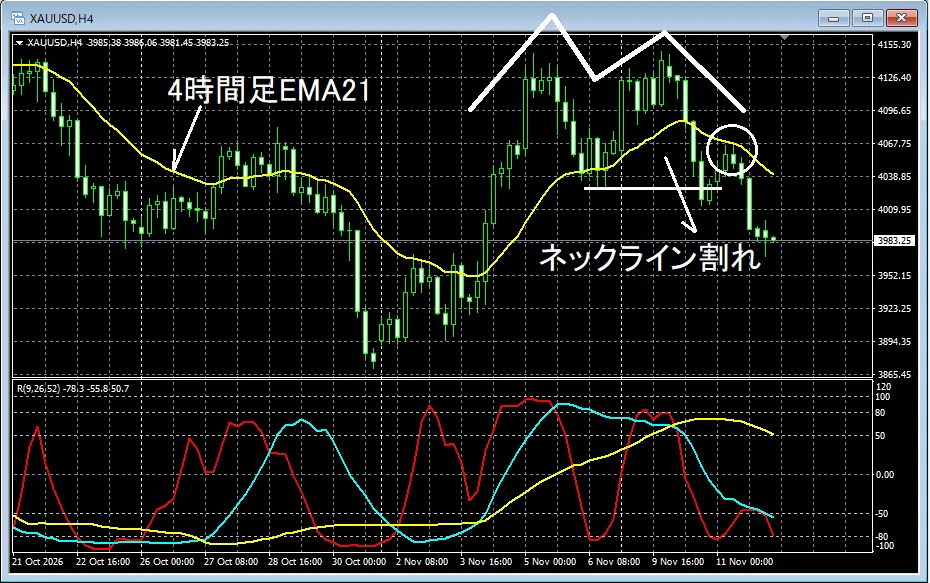
Looking at the 4-hour chart above,neckline breakforms adouble top, suggesting the possibility of a downward move on the 4-hour timeframe. Under a short-selling approach, we first watch around the4-hour EMA21area for signs of a bearish reversal on the lower timeframe.
Gold/USD XAUUSD 15-minute chart
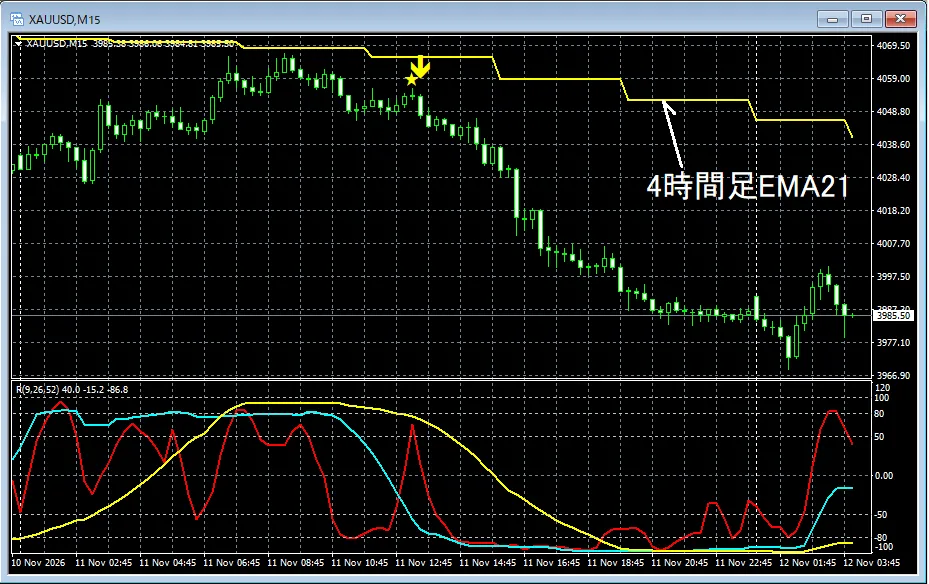
Continuing from the 4-hour chart, when we look at the upper 15-minute chart,the 4-hour EMA21is met with a slight rebound. Subsequently,the mBDSR (RCI two-line filter) signallights up at an opportune moment, and price clearly moves lower afterward.
In this case study, based on the 4-hour timeframe environmental awareness, we are able to capture entry timing on the 15-minute chart usingthe mBDSR signaleffectively.
By the way, after performing environmental awareness on the higher timeframe, which lower timeframe should you wait for entry timing on?
To answer this question, the included PDF provides a detailed explanation of“drilling down from higher to lower timeframes using three RCI lines”as well.
(3) Defense (SL setting on lower timeframe) and offense (ride the trend on the upper timeframe)
Here, using the above example (2), we discuss setting astop-loss on the lower timeframeand the movement on the upper timeframe.
Gold/USD XAUUSD 15-minute chart
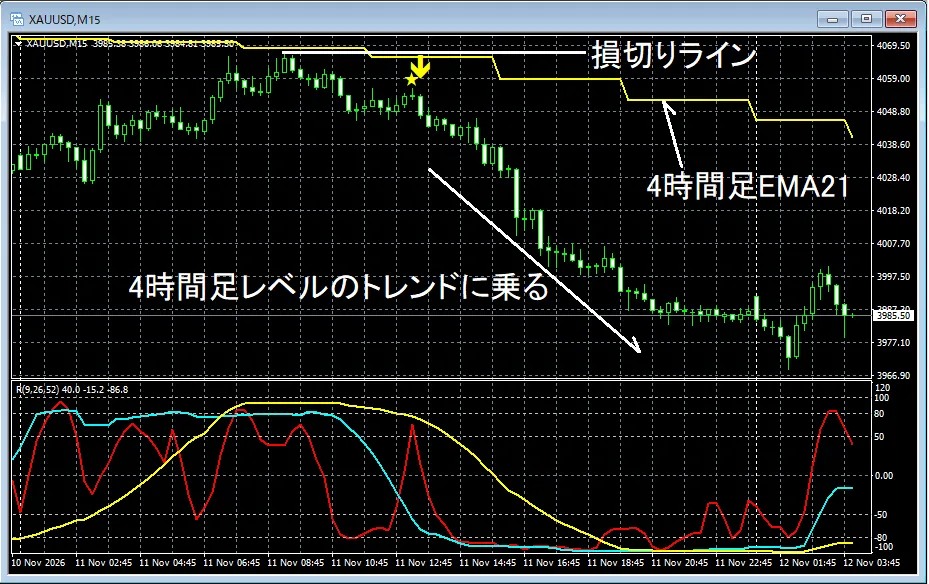
On the top 15-minute chart, if we place a stop-loss around the most recent high slightly above it, considering riding the trend on the 4-hour chart, the stop-loss width becomes smaller relative to the expected price move. In other words, it becomes possible to aim for a trade with favorable risk/reward.
On the lower 4-hour chart, the subsequent price action leads to a solid decline that ultimately tests the previous low on the daily chart.
Gold/USD XAUUSD 4-hour chart
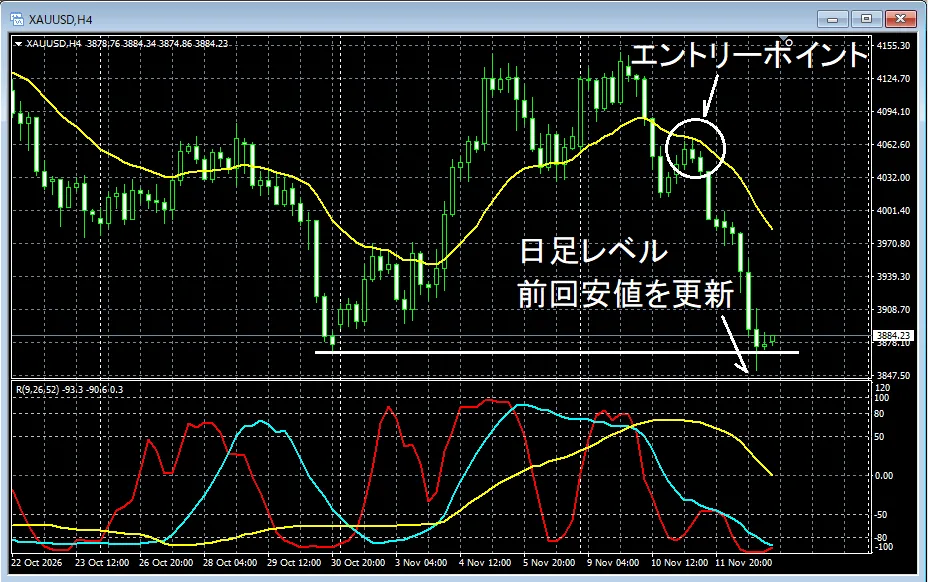
As described above, in this case study we observedsmall loss, large gain, that is,a trade with good risk-rewardwas possible.
To reiterate, this product includes a large number of case studies.
(4) Product overview
Indicator that shines in combination with RCI: 【BODSOR・mBDSR】
and methods and case studies (PDF) ★GogoJungle AWARD2020 winner★
https://www.gogojungle.co.jp/tools/indicators/11836
Over 550 PDF files (methods and case studies: total of 2,000 pages, over 700,000 characters) are included.
Many of these explainhow to logically link higher and lower timeframes using three RCI lines to sequentially analyze multiple lower timeframes, and ultimately wait for a dip-buy or a pullback timing (i.e., the mBDSR signal) on the lower timeframes..
Additionally,many entries emphasize capturing points where multiple entry reasons coincide..
Also included is a method for exploring upward and downward targets using RCI three-line analysis.
In the PDF explanations,more than 1,950 chartsare used.
【Reference videos related to RCI and mBDSR】
Bringing signals via environmental awareness and multi-timeframe analysis using RCI (Part 1)
https://www.youtube.com/watch?v=1prvET_M5mA
Bringing signals via environmental awareness and multi-timeframe analysis using RCI (Part 2)
https://www.youtube.com/watch?v=vR4oD-oMVQQ
Bringing signals via environmental awareness and multi-timeframe analysis using RCI (Part 3)
https://www.youtube.com/watch?v=C6DHn0lD-I4
Bringing signals via environmental awareness and multi-timeframe analysis using RCI (Part 4)
https://www.youtube.com/watch?v=QG1iNTnLyyQ
Bringing signals via environmental awareness and multi-timeframe analysis using RCI (Part 5)
https://www.youtube.com/watch?v=VYlGiy6Cllg
# Profit-taking investment tool
× ![]()