

Excel at RCI to the extreme!! Super Trend and mBDSR signals GBPUSD 30-minute chart
0
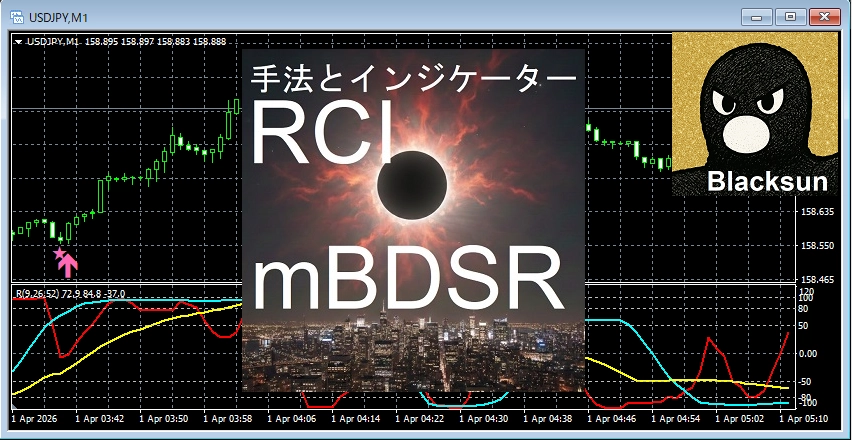
【Master RCI!! Trend Reversal, Buy the Dip, Sell the Rally】
Indicator that shines in combination with RCI: 【BODSOR・mBDSR】
and method, case studies (PDF) ★GogoJungle AWARD 2020 Winner★
https://www.gogojungle.co.jp/tools/indicators/11836
※This product 【BODSOR・mBDSR】 includes more than 550 PDFs (over 2,000 pages in total, over 1,950 chart images, over 700,000 words) as methods and case studies.
About the PDFs included with the above product
【BODSOR・mBDSR】 358 attached PDF files
https://www.gogojungle.co.jp/finance/navi/articles/34271
【Master RCI to Win!!】Summary of PDFs with explanations for mBDSR (Moving Average Filter)
https://www.gogojungle.co.jp/finance/navi/articles/90127
【Master RCI to Win!! PDF追加】A collection of PDFs for trading (day trading) using 5-minute chart signals
https://www.gogojungle.co.jp/finance/navi/articles/89870
【Master RCI to Win!!】A collection of PDFs for 1-minute short-term trading (scalping)
https://www.gogojungle.co.jp/finance/navi/articles/88762
【Master RCI to Win!!】PDF collection for 15-minute trading
https://www.gogojungle.co.jp/finance/navi/articles/113513
【Master RCI to Win!!】Collection of PDFs explaining profit-taking points
https://www.gogojungle.co.jp/finance/navi/articles/89471
PDF collection for effectively utilizing R1R2S2【Master RCI to Win!!】
https://www.gogojungle.co.jp/finance/navi/articles/93154
【Master RCI to Win!!】PDF collection for effectively using MT5 version mBDSR
https://www.gogojungle.co.jp/finance/navi/articles/84918
Below, we will introduce examples of signals formBDSR (RCI two-line filter)signals.
GBPUSD 30-minute chart
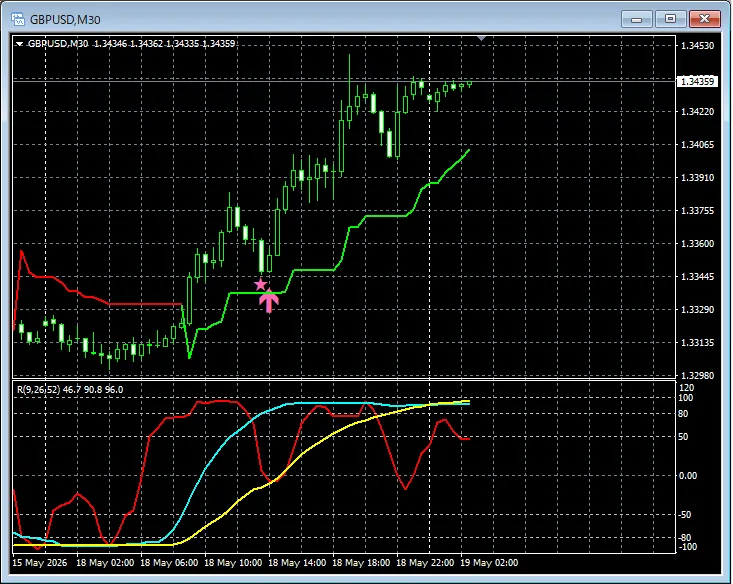
After breaking above the Super Trend resistance line, a pullback buy signal formBDSRis lit.
※Please note that in the charts introduced in this article, for convenience of explanation, there may be added circles, straight lines, or rectangles.
Indicator that shines in combination with RCI【BODSOR・mBDSR】
and method, case studies (PDF) ★GogoJungle AWARD 2020 Winner★
https://www.gogojungle.co.jp/tools/indicators/11836
550+ PDF files (method & case studies: over 2,000 pages, over 700,000 words) are included.
Many of them are about logically linking higher and lower timeframes by using three RCI lines, examining multiple lower-timeframe conditions in sequence, and ultimately waiting for pullbacks or pullback buy signals on the lower timeframes (i.e., the mBDSR signals).
Additionally,many focus on identifying points where multiple entry reasons overlap.There are also many that explore methods for detecting upward or downward targets using RCI three-line strategy.
In the PDF explanations,
over 1,950 charts are used.

Blacksun Indicators (List)
https://www.gogojungle.co.jp/finance/navi/articles/33779
Blacksun Free Indicators and Free E-Books
https://www.gogojungle.co.jp/finance/navi/articles/90181
【Reference Videos (RCI and mBDSR related)】
Environment recognition and multi-timeframe analysis using RCI to wait for signals (1)
https://www.youtube.com/watch?v=1prvET_M5mA
Environment recognition and multi-timeframe analysis using RCI to wait for signals (2)
https://www.youtube.com/watch?v=vR4oD-oMVQQ
Environment recognition and multi-timeframe analysis using RCI to wait for signals (3)
https://www.youtube.com/watch?v=C6DHn0lD-I4
Environment recognition and multi-timeframe analysis using RCI to wait for signals (4)
https://www.youtube.com/watch?v=QG1iNTnLyyQ
Environment recognition and multi-timeframe analysis using RCI to wait for signals (5)
https://www.youtube.com/watch?v=VYlGiy6Cllg
× ![]()


Is it OK?