

【Master RCI and win with moving average filter!】JP225 Nikkei 225 5-minute chart mBDSR signals
0
【Master RCI!! Trend Reversal, Buy on Dips, Sell on Rallies】
Indicator that shines in combination with RCI: 【BODSOR・mBDSR】
and methods & case studies (PDF) ★GogoJungle AWARD2020 winner★
https://www.gogojungle.co.jp/tools/indicators/11836
※This product 【BODSOR・mBDSR】 includes more than 550 PDFs (over 2,000 pages in total, over 1,950 charts, over 700,000 words) as methods and case studies.
Regarding the PDFs included in the above product
【BODSOR・mBDSR】 358 included PDF files
https://www.gogojungle.co.jp/finance/navi/articles/34271
【Mastering RCI!!】A summary of PDFs describing mBDSR (Moving Average Filter)
https://www.gogojungle.co.jp/finance/navi/articles/90127
【Mastering RCI!! 追加 PDFs】 A collection of PDFs for trading using 5-minute signals (Day Trading)
https://www.gogojungle.co.jp/finance/navi/articles/89870
【Mastering RCI!!】 A collection of PDFs for 1-minute short-term trading (scalping)
https://www.gogojungle.co.jp/finance/navi/articles/88762
【Mastering RCI!!】 A collection of PDFs for 15-minute trading
https://www.gogojungle.co.jp/finance/navi/articles/113513
【Mastering RCI!!】 A summary of PDFs describing profit-taking points
https://www.gogojungle.co.jp/finance/navi/articles/89471
PDF collection to effectively utilize R1R2S2【Mastering RCI!!】
https://www.gogojungle.co.jp/finance/navi/articles/93154
【Mastering RCI!!】 PDF collection to effectively use the MT5 version of mBDSR
https://www.gogojungle.co.jp/finance/navi/articles/84918
mBDSR (RCI Filter)andmBDSR (Moving Average Filter)have different roles. The accompanying PDFs also discuss how to use them distinctly.
Below,mBDSR (Moving Average Filter)signal examples are introduced.
Nikkei Average / JP225 5-minute chart
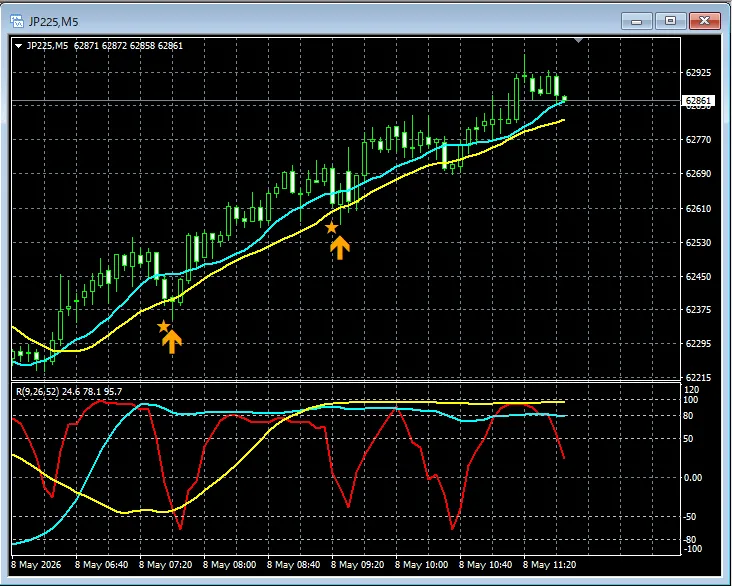
In the chart above,the mBDSR (Moving Average Filter) signallights up at well-timed moments.
In the case of the Moving Average Filter mBDSRas well,using it in conjunction with the higher-timeframe to lower-timeframe drop using the three RCI linesenables high-probability trades. This is also explained in the included PDFs.
※ Please note that in the charts shown in this article, for convenience of explanation, circles, lines, and rectangles may be drawn.
Indicator that shines in combination with RCI【BODSOR・mBDSR】
and methods & case studies (PDF) ★GogoJungle AWARD2020 winner★
https://www.gogojungle.co.jp/tools/indicators/11836
Includes more than 550 PDF files (methods & case studies: over 2,000 pages, over 700,000 words).
Most of these are examples where multiple lower-timeframe conditions are tied logically by using the three RCI lines to link higher and lower timeframes, ultimately waiting for dips in the lower timeframes (i.e., mBDSR signals).
Also,many items focus on capturing points where multiple entry bases overlap.There are also techniques that explore upward and downward targets using the three RCI lines.
In the PDF explanations,
over 1,950 charts are used.

Blacksun Indicators (List)
https://www.gogojungle.co.jp/finance/navi/articles/33779
Blacksun Free Indicators and Free E-books
https://www.gogojungle.co.jp/finance/navi/articles/90181
【Reference Videos (RCI and mBDSR related)】
Environment recognition with RCI and multi-timeframe analysis leading to waiting for signals (1)
https://www.youtube.com/watch?v=1prvET_M5mA
Environment recognition with RCI and multi-timeframe analysis leading to waiting for signals (2)
https://www.youtube.com/watch?v=vR4oD-oMVQQ
Environment recognition with RCI and multi-timeframe analysis leading to waiting for signals (3)
https://www.youtube.com/watch?v=C6DHn0lD-I4
Environment recognition with RCI and multi-timeframe analysis leading to waiting for signals (4)
https://www.youtube.com/watch?v=QG1iNTnLyyQ
Environment recognition with RCI and multi-timeframe analysis leading to waiting for signals (5)
https://www.youtube.com/watch?v=VYlGiy6Cllg
× ![]()


