

[Master RCI to Win!!] Latest Crude Oil WTI 4-Hour Chart Double Top and mbDSR Signals
0
【Mastering RCI!! Trend Reversal, Buy on Dips, Sell on Rallies】
Indicator that shines in combination with RCI: 【BODSOR・mBDSR】
Methods, and Case Studies (PDF) ★GogoJungle AWARD2020 Winner★
https://www.gogojungle.co.jp/tools/indicators/11836
This product 【BODSOR・mBDSR】 includes over 550 PDFs (over 2,000 pages in total, over 1,950 chart images, over 700,000 characters) as methods and case studies.
About the PDFs included in the above product
【BODSOR・mBDSR】 358 attached PDF files
https://www.gogojungle.co.jp/finance/navi/articles/34271
【Mastering RCI!!】 Summary of PDFs describing mBDSR (Moving Average Filter)
https://www.gogojungle.co.jp/finance/navi/articles/90127
【Mastering RCI!!】 Added PDFs for trading using 5-minute signals (Day trading)
https://www.gogojungle.co.jp/finance/navi/articles/89870
【Mastering RCI!!】 PDF collection for short-term 1-minute trades (Scalping)
https://www.gogojungle.co.jp/finance/navi/articles/88762
【Mastering RCI!!】 PDF collection for 15-minute trades
https://www.gogojungle.co.jp/finance/navi/articles/113513
【Mastering RCI!!】 Summary of PDFs describing exit points
https://www.gogojungle.co.jp/finance/navi/articles/89471
PDF collection for effectively using R1R2S2 【Mastering RCI!!】
https://www.gogojungle.co.jp/finance/navi/articles/93154
【Mastering RCI!!】 PDF collection for efficiently utilizing MT5版 mBDSR
https://www.gogojungle.co.jp/finance/navi/articles/84918
Below,We introduce examples of signals for mBDSR (RCI two-line filter).
AUDJPY 4-hour chart
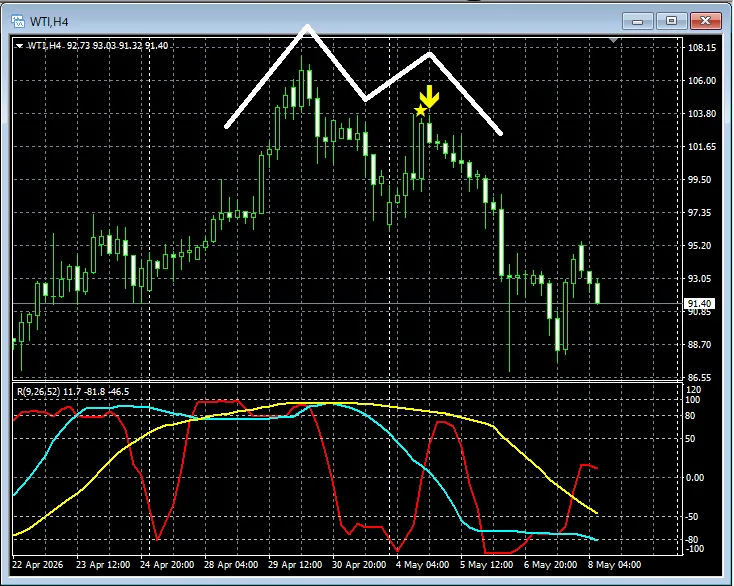
In the chart above,signals of mBDSR (RCI two-line filter)light up at the right timing.
※ Please note that the charts shown in this article may include added marks such as yen symbols, straight lines, or rectangles for readability.
Indicator that shines in combination with RCI: 【BODSOR・mBDSR】
Methods and Case Studies (PDF) ★GogoJungle AWARD2020 Winner★
https://www.gogojungle.co.jp/tools/indicators/11836
Includes over 550 PDF files (Methods and Case Studies: over 2,000 pages, over 700,000 characters).
Many of them explain how to logically link higher and lower timeframes using the RCI-3-line, ultimately examining multiple lower-timeframe conditions and waiting for dips or rallies signals (i.e., mBDSR signals) on the lower timeframe.
Also,there are many that focus on capturing points where multiple entry reasons coincide..
Additionally,there are methods that explore upside and downside targets using the RCI-3-line..
In the PDF explanations,over 1,950 chartsare used.

Blacksun Indicators (List)
https://www.gogojungle.co.jp/finance/navi/articles/33779
About Blacksun free indicators and free e-books
https://www.gogojungle.co.jp/finance/navi/articles/90181
【Reference Videos (RCI and mBDSR related)】
Bring signals by environmental awareness and multi-time frame analysis using RCI (1)
https://www.youtube.com/watch?v=1prvET_M5mA
Bring signals by environmental awareness and multi-time frame analysis using RCI (2)
https://www.youtube.com/watch?v=vR4oD-oMVQQ
Bring signals by environmental awareness and multi-time frame analysis using RCI (3)
https://www.youtube.com/watch?v=C6DHn0lD-I4
Bring signals by environmental awareness and multi-time frame analysis using RCI (4)
https://www.youtube.com/watch?v=QG1iNTnLyyQ
Bring signals by environmental awareness and multi-time frame analysis using RCI (5)
https://www.youtube.com/watch?v=VYlGiy6Cllg
× ![]()


