

Master RCI to the extreme!! AUDUSD 15-minute chart rebound selling signal and pullback buying signal
0
【Master RCI!! Trend Reversals, Buy Dips, Sell on Rallies】
Indicator【BODSOR・mBDSR】that shines when combined with RCI
and methods, case studies (PDF) ★Winner of GogoJungle AWARD2020★
https://www.gogojungle.co.jp/tools/indicators/11836
This product【BODSOR・mBDSR】includes over 550 PDFs (over 2,000 pages, over 1,950 chart images, over 700,000 characters) as methods and case studies.
About the PDFs included with the above product
About the 358 PDF files included with【BODSOR・mBDSR】
https://www.gogojungle.co.jp/finance/navi/articles/34271
【Master RCI and Win!!】Summary of PDFs describing mBDSR (Moving Average Filter)
https://www.gogojungle.co.jp/finance/navi/articles/90127
【Master RCI and Win!!】PDF collection for trading using 5-minute chart signals (Day trading)
https://www.gogojungle.co.jp/finance/navi/articles/89870
【Master RCI and Win!!】PDF collection for 1-minute short-term trading (scalping)
https://www.gogojungle.co.jp/finance/navi/articles/88762
【Master RCI and Win!!】PDF collection for 15-minute trading
https://www.gogojungle.co.jp/finance/navi/articles/113513
【Master RCI and Win!!】Summary of PDFs explaining profit-taking points
https://www.gogojungle.co.jp/finance/navi/articles/89471
PDFs to effectively utilize R1R2S2【Master RCI and Win!!】
https://www.gogojungle.co.jp/finance/navi/articles/93154
【Master RCI and Win!!】PDF collection to effectively use the MT5 version of mBDSR
https://www.gogojungle.co.jp/finance/navi/articles/84918
Below, we introduce examples of signals formBDSR (RCI two-filter)signals.
AUD/USD 15-minute chart
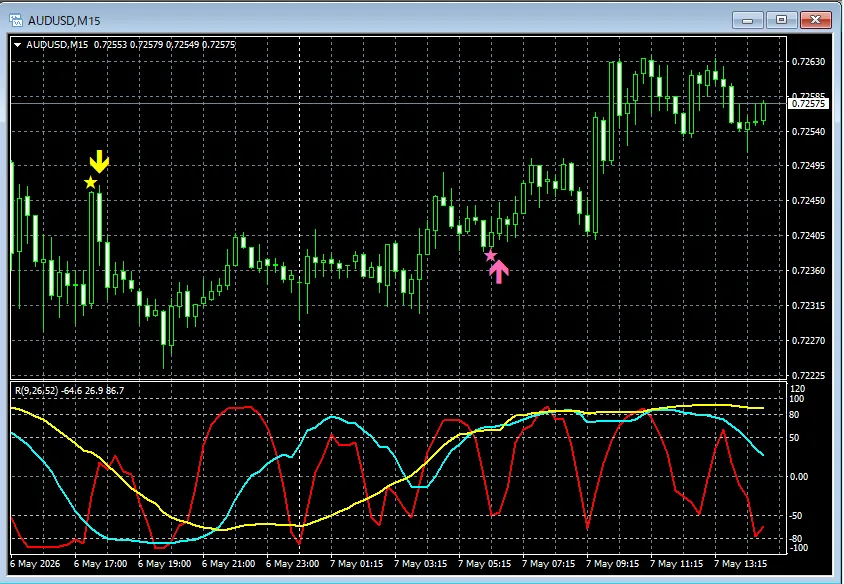
In the chart above,signals of mBDSR (RCI two-filter)light up at the right timing.
※Note: In the charts shown in this article, for convenience of explanation, some elements such as currency marks, straight lines, and rectangles may have been added, so please understand.
Indicator that shines when combined with RCI【BODSOR・mBDSR】
and methods, case studies (PDF) ★Winner of GogoJungle AWARD2020★
https://www.gogojungle.co.jp/tools/indicators/11836
Contains over 550 PDF files (methods and case studies: over 2,000 pages, over 700,000 characters).
Most of them are focused on logically linking higher and lower timeframes using three RCI lines to examine multiple lower-timeframe situations in sequence, ultimately waiting for a dip-buy or pullback-sell timing (i.e., mBDSR signals) on the lower timeframe.
Additionally,there are many that emphasize identifying points where multiple entry reasons overlap.Also included is a method to explore upward and downward targets using three RCI lines.
In the PDF descriptions,
over 1,950 chartsare used.

Blacksun Indicators (List)
https://www.gogojungle.co.jp/finance/navi/articles/33779
Free Blacksun indicators and free e-books
https://www.gogojungle.co.jp/finance/navi/articles/90181
【Reference videos (RCI and mBDSR related)】
Understanding the environment with RCI and multi-timeframe analysis to bring the signal waiting process to a form (1)
https://www.youtube.com/watch?v=1prvET_M5mA
Understanding the environment with RCI and multi-timeframe analysis to bring the signal waiting process to a form (2)
https://www.youtube.com/watch?v=vR4oD-oMVQQ
Understanding the environment with RCI and multi-timeframe analysis to bring the signal waiting process to a form (3)
https://www.youtube.com/watch?v=C6DHn0lD-I4
Understanding the environment with RCI and multi-timeframe analysis to bring the signal waiting process to a form (4)
https://www.youtube.com/watch?v=QG1iNTnLyyQ
Understanding the environment with RCI and multi-timeframe analysis to bring the signal waiting process to a form (5)
https://www.youtube.com/watch?v=VYlGiy6Cllg
× ![]()


