

Exchange intervention? [Master RCI to win!!] Latest USD/JPY 5-minute chart mBDSR signal
0
【Master RCI!! Trend Reversal, Buy on Dips, Sell on Rallies】
Indicator that shines in combination with RCI: 【BODSOR・mBDSR】
Methods and Case Studies (PDF) ★GogoJungle AWARD2020 Winner★
https://www.gogojungle.co.jp/tools/indicators/11836
This product 【BODSOR・mBDSR】 includes over 550 PDFs (over 2,000 pages, over 1,950 chart images, over 700,000 characters) as methods and case studies.
About the PDFs included in the above product
About the 358 PDF files included with 【BODSOR・mBDSR】
https://www.gogojungle.co.jp/finance/navi/articles/34271
【Master RCI to Win!!】Summary of PDFs with explanations about mBDSR (Moving Average Filter)
https://www.gogojungle.co.jp/finance/navi/articles/90127
【Master RCI to Win!!】 PDF collection for trading (Day trading) using 5-minute signals
https://www.gogojungle.co.jp/finance/navi/articles/89870
【Master RCI to Win!!】 PDF collection for 1-minute short-term trading (scalping)
https://www.gogojungle.co.jp/finance/navi/articles/88762
【Master RCI to Win!!】 PDF collection for 15-minute trading
https://www.gogojungle.co.jp/finance/navi/articles/113513
【Master RCI to Win!!】 PDFs explaining profit-taking points
https://www.gogojungle.co.jp/finance/navi/articles/89471
PDF collection to effectively use R1R2S2【Master RCI to Win!!】
https://www.gogojungle.co.jp/finance/navi/articles/93154
【Master RCI to Win!!】 PDF collection to effectively utilize MT5 version of mBDSR
https://www.gogojungle.co.jp/finance/navi/articles/84918
Below, we introducesign examples of mBDSR (RCI two-filter)as signals.
USDJPY 5-minute chart
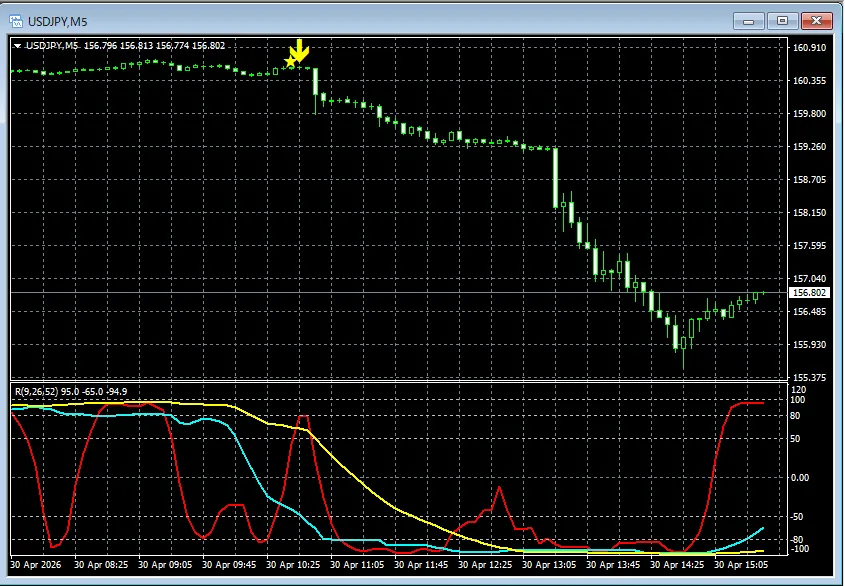
In the chart above,the signal of mBDSR (RCI two-filter)lights up at the right timing.
※ Please note that in the charts introduced in this article, for convenience of explanation, some elements such as currency units, lines, and rectangles may be drawn.
Indicator that shines in combination with RCI: 【BODSOR・mBDSR】
Methods and Case Studies (PDF) ★GogoJungle AWARD2020 Winner★
https://www.gogojungle.co.jp/tools/indicators/11836
Over 550 PDF files (methods and case studies: over 2,000 pages, over 700,000 characters) are included.
Many of these are structured as follow: using three RCI lines to logically link higher and lower timeframes, then progressively analyze multiple lower-timeframe conditions, ultimately waiting for dips/buys or rallies/sells on the lower timeframe signals (mBDSR).
Additionally,many are focused on identifying points where multiple exit-entry bases overlap.There are also many that explore methods to identify upside and downside targets using three-RCI-line analysis.
In the PDF explanations,
more than 1,950 chartsare used.

Blacksun Indicators (List)
https://www.gogojungle.co.jp/finance/navi/articles/33779
Free Blacksun indicators and free e-books
https://www.gogojungle.co.jp/finance/navi/articles/90181
【Reference Videos (RCI and mBDSR related)】
Sign waiting form using RCI through environmental awareness and multi-time-frame analysis (1)
https://www.youtube.com/watch?v=1prvET_M5mA
Sign waiting form using RCI through environmental awareness and multi-time-frame analysis (2)
https://www.youtube.com/watch?v=vR4oD-oMVQQ
Sign waiting form using RCI through environmental awareness and multi-time-frame analysis (3)
https://www.youtube.com/watch?v=C6DHn0lD-I4
Sign waiting form using RCI through environmental awareness and multi-time-frame analysis (4)
https://www.youtube.com/watch?v=QG1iNTnLyyQ
Sign waiting form using RCI through environmental awareness and multi-time-frame analysis (5)
https://www.youtube.com/watch?v=VYlGiy6Cllg
× ![]()


