

[Master RCI] Mastering RCI!! Super Trend and mBDSR Signals USD/JPY 5-minute chart
0
【Master RCI!! Trend Reversal, Buy on Dip, Sell on Rally】
Indicator that shines in combination with RCI【BODSOR・mBDSR】
Methods and Case Studies (PDF) ★GogoJungle AWARD2020 Winner★
https://www.gogojungle.co.jp/tools/indicators/11836
※This product【BODSOR・mBDSR】includes more than 550 PDFs (over 2,000 pages in total, over 1,950 charts, more than 700,000 words) as methods and case studies.
About the PDFs included in the above product
358 PDFs included with【BODSOR・mBDSR】
https://www.gogojungle.co.jp/finance/navi/articles/34271
【Master RCI】 Summary of PDFs explaining mBDSR (Moving Average Filter)
https://www.gogojungle.co.jp/finance/navi/articles/90127
【Master RCI】 Added PDFs for trading using 5-minute signals (Day Trading)
https://www.gogojungle.co.jp/finance/navi/articles/89870
【Master RCI】 PDFs for 1-minute short-term trading (Scalping)
https://www.gogojungle.co.jp/finance/navi/articles/88762
【Master RCI】 PDFs for 15-minute trading
https://www.gogojungle.co.jp/finance/navi/articles/113513
【Master RCI】 PDFs summarizing profit-taking points
https://www.gogojungle.co.jp/finance/navi/articles/89471
PDF collection for effectively using R1R2S2【Master RCI】
https://www.gogojungle.co.jp/finance/navi/articles/93154
【Master RCI】 PDFs for effectively utilizing MT5 version of mBDSR
https://www.gogojungle.co.jp/finance/navi/articles/84918
Below,introduced are examples of signals for mBDSR (RCI 2-line filter)on the USDJPY 5-minute chart
USDJPY 5-minute
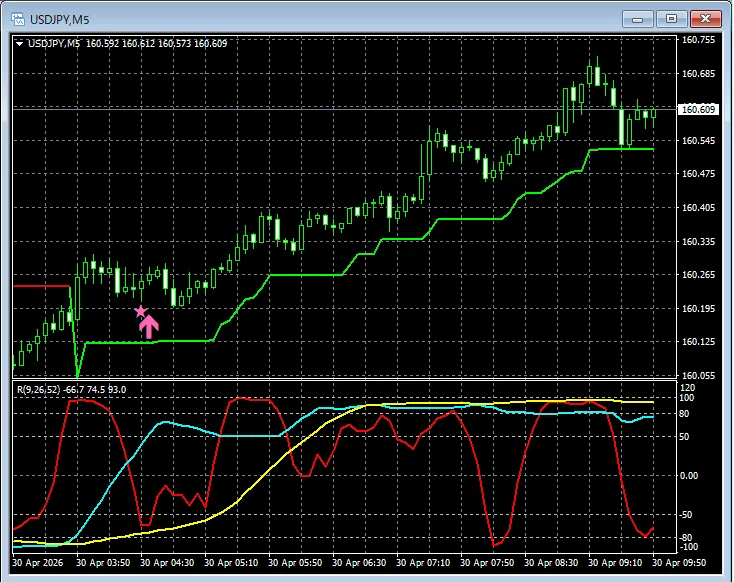
After break above the resistance line of the Super Trend,a pullback buy signal ofmBDSRlights up on the pullback signal pattern.
※Please note that to aid explanation, some charts in this article may include added elements such as circles, straight lines, or rectangles.
Indicator that shines in combination with RCI【BODSOR・mBDSR】
Methods and Case Studies (PDF) ★GogoJungle AWARD2020 Winner★
https://www.gogojungle.co.jp/tools/indicators/11836
Includes more than 550 PDF files (Methods and Case Studies: over 2,000 pages in total, over 700,000 words).
Many of them are: summaries of how to logically link higher and lower timeframes using the RCI 3-line strategy, then sequentially examine multiple lower timeframes and ultimately wait for pullback buys or pullback sells on the lower timeframes (i.e., mBDSR signals)..
Also,many materials emphasize capturing points where multiple entry reasons overlap..
Additionally,there are methods using the RCI 3-line to explore upside and downside targets..
In the PDF explanations,over 1,950 charts are used..

Blacksun Indicators (List)
https://www.gogojungle.co.jp/finance/navi/articles/33779
Free Blacksun indicators and free e-books
https://www.gogojungle.co.jp/finance/navi/articles/90181
【Reference Videos (RCI and mBDSR related)】
Bring in signals through environmental recognition and multi-timeframe analysis using RCI (1)
https://www.youtube.com/watch?v=1prvET_M5mA
Bring in signals through environmental recognition and multi-timeframe analysis using RCI (2)
https://www.youtube.com/watch?v=vR4oD-oMVQQ
Bring in signals through environmental recognition and multi-timeframe analysis using RCI (3)
https://www.youtube.com/watch?v=C6DHn0lD-I4
Bring in signals through environmental recognition and multi-timeframe analysis using RCI (4)
https://www.youtube.com/watch?v=QG1iNTnLyyQ
Bring in signals through environmental recognition and multi-timeframe analysis using RCI (5)
https://www.youtube.com/watch?v=VYlGiy6Cllg
× ![]()


