

【Master RCI to the Extreme!!】Super Trend and mBDSR Signals
0
【Mastering RCI!! Trend Reversals, Buy Dips, Sell at Rallies】
Indicators that shine when used in combination with RCI【BODSOR・mBDSR】
Methods, and Case Studies (PDF) ★GogoJungle AWARD2020 winner★
https://www.gogojungle.co.jp/tools/indicators/11836
This product【BODSOR・mBDSR】includes over 550 PDFs (over 2,000 pages, over 1,950 charts, over 700,000 characters) as methods and case studies.
About the PDFs included in the above product
358 PDF files included with 【BODSOR・mBDSR】
https://www.gogojungle.co.jp/finance/navi/articles/34271
【Mastering RCI!!】A summary of PDFs describing mBDSR (Moving Average Filter)
https://www.gogojungle.co.jp/finance/navi/articles/90127
【Mastering RCI!!】追加PDFs for trading using 5-minute signals (Day Trading) – PDF collection
https://www.gogojungle.co.jp/finance/navi/articles/89870
【Mastering RCI!!】PDF collection for 1-minute short-term trading (Scalping)
https://www.gogojungle.co.jp/finance/navi/articles/88762
【Mastering RCI!!】PDF collection for 15-minute trading
https://www.gogojungle.co.jp/finance/navi/articles/113513
【Mastering RCI!!】PDF summary describing profit-taking points
https://www.gogojungle.co.jp/finance/navi/articles/89471
PDF collection for effectively utilizing R1R2S2【Mastering RCI!!】
https://www.gogojungle.co.jp/finance/navi/articles/93154
【Mastering RCI!!】PDF collection for effectively using MT5 version of mBDSR
https://www.gogojungle.co.jp/finance/navi/articles/84918
Below we introducesign examples of mBDSR (RCI two-filter).
USD/JPY CADJPY 5-minute chart
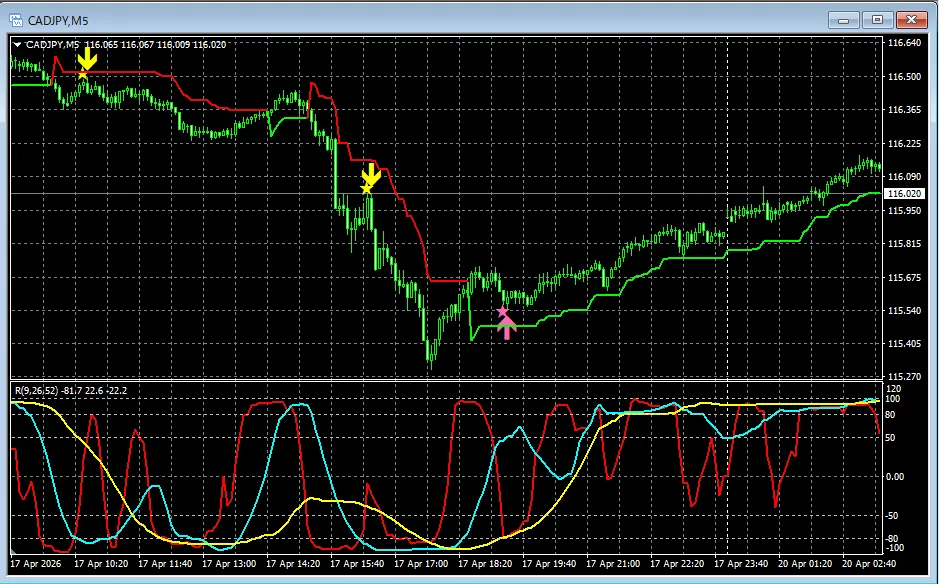
After the break below the support line of the Super Trendthe sell signal on mBDSR lights up (twice).
After the breakout above the resistance line of the Super Trenda pullback triggers a buy signal on mBDSR.
※ Please note that in the charts shown in this article, for convenience of explanation, circles, lines, and squares may be added.
Indicator that shines when combined with RCI【BODSOR・mBDSR】
Methods and Case Studies (PDF) ★GogoJungle AWARD2020 winner★
https://www.gogojungle.co.jp/tools/indicators/11836
Includes over 550 PDF files (Methods and Case Studies: over 2,000 pages, over 700,000 characters).
Most of them arecollections that logically link higher and lower timeframes using three RCI lines to sequentially analyze multiple lower timeframes and ultimately wait for pullbacks or sell-offs on the lower timeframe (the mBDSR signals)..
Also,with emphasis on capturing points where multiple entry reasons overlap.
Additionally,techniques to investigate upward or downward targets using three RCI lines are included..
In the PDF files,over 1,950 charts are used..

Blacksun Indicators (List)
https://www.gogojungle.co.jp/finance/navi/articles/33779
Blacksun Free Indicators and Free eBooks
https://www.gogojungle.co.jp/finance/navi/articles/90181
【Reference Videos (RCI and mBDSR related)】
Environmental awareness with RCI and multi-timeframe analysis to wait for signals (Part 1)
https://www.youtube.com/watch?v=1prvET_M5mA
Environmental awareness with RCI and multi-timeframe analysis to wait for signals (Part 2)
https://www.youtube.com/watch?v=vR4oD-oMVQQ
Environmental awareness with RCI and multi-timeframe analysis to wait for signals (Part 3)
https://www.youtube.com/watch?v=C6DHn0lD-I4
Environmental awareness with RCI and multi-timeframe analysis to wait for signals (Part 4)
https://www.youtube.com/watch?v=QG1iNTnLyyQ
Environmental awareness with RCI and multi-timeframe analysis to wait for signals (Part 5)
https://www.youtube.com/watch?v=VYlGiy6Cllg
× ![]()


