

Master RCI to the extreme!! NZDJPY 5-minute chart mBDSR signal
0
【Mastering RCI!! Trend Reversals, Buy on Dips, Sell on Rallies】
Indicator that shines when combined with RCI: 【BODSOR・mBDSR】
Methods and Case Studies (PDF) ★GogoJungle AWARD2020 Winner★
https://www.gogojungle.co.jp/tools/indicators/11836
※This product【BODSOR・mBDSR】includes over 550 PDFs (over 2,000 pages in total, over 1,950 chart pages, over 700,000 characters in total) as methods and case studies.
About the PDFs Included in the Above Product
About the 358 PDF files Included with 【BODSOR・mBDSR】
https://www.gogojungle.co.jp/finance/navi/articles/34271
【Mastering RCI!!】 Summary of PDFs with explanations on mBDSR (Moving Average Filter)
https://www.gogojungle.co.jp/finance/navi/articles/90127
【Mastering RCI!!】 Additional PDFs for trading using 5-minute signals (Day Trading) collection
https://www.gogojungle.co.jp/finance/navi/articles/89870
【Mastering RCI!!】 PDF collection for 1-minute short-term trading (scalping)
https://www.gogojungle.co.jp/finance/navi/articles/88762
【Mastering RCI!!】 PDF collection for 15-minute trading
https://www.gogojungle.co.jp/finance/navi/articles/113513
【Mastering RCI!!】 Summary of PDFs explaining profit-taking points
https://www.gogojungle.co.jp/finance/navi/articles/89471
PDF collection for effectively utilizing R1R2S2【Mastering RCI!!】
https://www.gogojungle.co.jp/finance/navi/articles/93154
【Mastering RCI!!】 PDF collection for effectively using MT5 version mBDSR
https://www.gogojungle.co.jp/finance/navi/articles/84918
Below, we introduce examples of signals ofmBDSR (RCI two-line filter)signals.
New Zealand Yen NZDJPY 5-minute chart
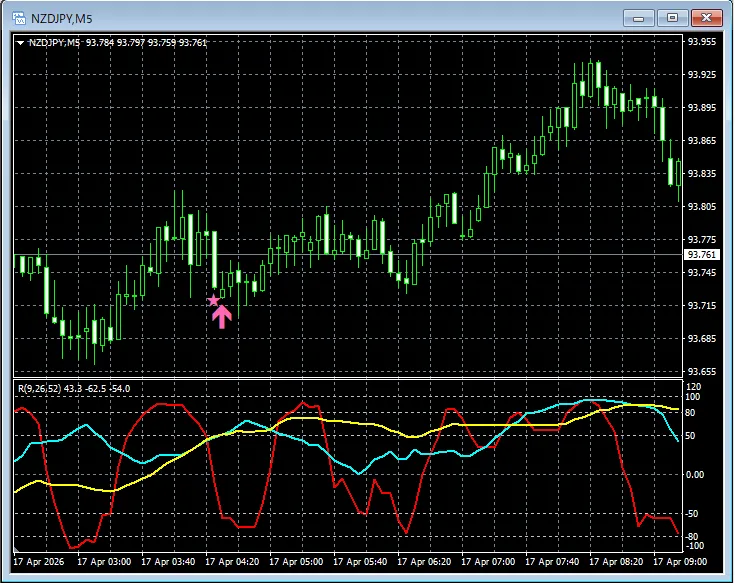
In the chart above,Signals of mBDSR (RCI two-line filter)are lighting up at timely moments.
※ Please note that in the charts shown in this article, for convenience of explanation, circles, straight lines, squares, etc. may have been added.
Indicator that shines when combined with RCI【BODSOR・mBDSR】
Methods and Case Studies (PDF) ★GogoJungle AWARD2020 Winner★
https://www.gogojungle.co.jp/tools/indicators/11836
Includes over 550 PDF files (Methods and Case Studies: over 2,000 pages, over 700,000 characters).
Many of these are designed to logically link higher and lower timeframes using three RCI lines, examining multiple lower-timeframe conditions step by step, and ultimately waiting for dips or pullbacks signals on the lower timeframe (the mBDSR sign).
Additionally,many emphasize capturing points where multiple entry reasons align.There are also many examples.
Furthermore,the method also includes exploring upside and downside targets using three-line RCI.The PDFs include explanations using
more than 1,950 charts..

Blacksun's Indicators (List)
https://www.gogojungle.co.jp/finance/navi/articles/33779
About Blacksun's Free Indicators and Free E-Books
https://www.gogojungle.co.jp/finance/navi/articles/90181
【Reference Videos (RCI and mBDSR related)】
Signaling environment recognition and multi-time-frame analysis with waiting for signals (1)
https://www.youtube.com/watch?v=1prvET_M5mA
Signaling environment recognition and multi-time-frame analysis with waiting for signals (2)
https://www.youtube.com/watch?v=vR4oD-oMVQQ
Signaling environment recognition and multi-time-frame analysis with waiting for signals (3)
https://www.youtube.com/watch?v=C6DHn0lD-I4
Signaling environment recognition and multi-time-frame analysis with waiting for signals (4)
https://www.youtube.com/watch?v=QG1iNTnLyyQ
Signaling environment recognition and multi-time-frame analysis with waiting for signals (5)
https://www.youtube.com/watch?v=VYlGiy6Cllg
× ![]()


