

【Master RCI to win with a moving average filter!!】EURJPY 15-minute chart mBDSR signal
0
【Master RCI!! Trend Reversal, Buy the Dip, Sell on the Rally】
Indicator that shines when combined with RCI: 【BODSOR・mBDSR】
and methods, case studies (PDF) ★GogoJungle AWARD2020 Winner★
https://www.gogojungle.co.jp/tools/indicators/11836
※This product【BODSOR・mBDSR】includes over 550 PDFs (over 2,000 pages in total, over 1,950 chart images, over 700,000 characters) as methods and case studies.
Regarding the PDFs included with the above product
358 PDF files included for【BODSOR・mBDSR】
https://www.gogojungle.co.jp/finance/navi/articles/34271
【Master RCI to Win!!】Summary of PDFs describing mBDSR (Moving Average Filter)
https://www.gogojungle.co.jp/finance/navi/articles/90127
【Master RCI to Win!!】PDF collection for trading (Day trading) using 5-minute signal
https://www.gogojungle.co.jp/finance/navi/articles/89870
【Master RCI to Win!!】PDF collection for 1-minute short-term trading (scalping)
https://www.gogojungle.co.jp/finance/navi/articles/88762
【Master RCI to Win!!】PDF collection for 15-minute trading
https://www.gogojungle.co.jp/finance/navi/articles/113513
【Master RCI to Win!!】Summary of PDFs explaining profit-taking points
https://www.gogojungle.co.jp/finance/navi/articles/89471
PDF collection for effectively using R1R2S2【Master RCI to Win!!】
https://www.gogojungle.co.jp/finance/navi/articles/93154
【Master RCI to Win!!】PDF collection for effectively using MT5版mBDSR
https://www.gogojungle.co.jp/finance/navi/articles/84918
mBDSR (RCI Filter)andmBDSR (Moving Average Filter)have different roles. The accompanying PDFs also discuss how to use them appropriately.
Below, we introduce examples of signs formBDSR (Moving Average Filter)signals.
EURJPY 15-minute
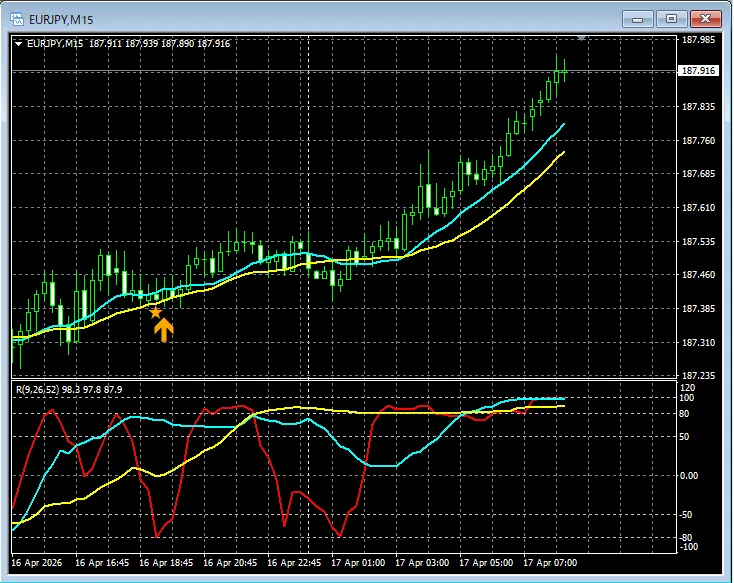
In the chart above,the signal from mBDSR (Moving Average Filter)lights up at the right timing.
In the case of the Moving Average Filter mBDSRas well,using it in conjunction with the higher-timeframe consolidation down to the lower timeframe using the three RCI linesallows for trades with high edge. This is also explained in the attached PDF.
※Please note that the charts mentioned in this article may have lines, shapes, or straight lines added for explanation convenience.
Indicator that shines when combined with RCI【BODSOR・mBDSR】
and methods, case studies (PDF) ★GogoJungle AWARD2020 Winner★
https://www.gogojungle.co.jp/tools/indicators/11836
Over 550 PDF files (methods and case studies: over 2,000 pages, over 700,000 characters) are included.
Many of these are summarized as examples of logically linking higher and lower timeframes using the three RCI lines, then sequentially examining multiple lower-timeframe conditions, and ultimately waiting for dip-buying or pullback selling timing (the mBDSR signal) on the lower timeframe.
Also,many of them emphasize identifying points where multiple entry signals overlap.There are also contents exploring how to identify upward or downward targets using the RCI three-line method.
In the PDF explanations,over 1,950 charts are used.
.

Blacksun Indicators (List)
https://www.gogojungle.co.jp/finance/navi/articles/33779
Blacksun Free Indicators and Free eBooks
https://www.gogojungle.co.jp/finance/navi/articles/90181
【Reference Videos (RCI and mBDSR related)】
Sign waiting shape using RCI with environment recognition and multi-time frame analysis (Part 1)
https://www.youtube.com/watch?v=1prvET_M5mA
Sign waiting shape using RCI with environment recognition and multi-time frame analysis (Part 2)
https://www.youtube.com/watch?v=vR4oD-oMVQQ
Sign waiting shape using RCI with environment recognition and multi-time frame analysis (Part 3)
https://www.youtube.com/watch?v=C6DHn0lD-I4
Sign waiting shape using RCI with environment recognition and multi-time frame analysis (Part 4)
https://www.youtube.com/watch?v=QG1iNTnLyyQ
Sign waiting shape using RCI with environment recognition and multi-time frame analysis (Part 5)
https://www.youtube.com/watch?v=VYlGiy6Cllg
× ![]()


