

[Mastering RCI to Win with a Moving Average Filter!!] Nikkei 225 4-hour chart mBDSR signal
0
【Mastering RCI!! Trend Reversal, Buy on Dips, Sell on Rise】
Indicator that shines when combined with RCI: 【BODSOR・mBDSR】
and its methods, case studies (PDF) ★GogoJungle AWARD2020 Winner★
https://www.gogojungle.co.jp/tools/indicators/11836
※This product 【BODSOR・mBDSR】 includes more than 550 PDFs (over 2,000 pages, over 1,950 chart images, over 700,000 characters) as methods and case studies.
About the PDFs Included in the Above Product
Regarding the 358 PDF files included with 【BODSOR・mBDSR】
https://www.gogojungle.co.jp/finance/navi/articles/34271
【Mastering RCI!!】 Summary of PDFs describing mBDSR (moving average filter)
https://www.gogojungle.co.jp/finance/navi/articles/90127
【Mastering RCI!!】 PDF collection for trading using 5-minute chart signals (Day trading)
https://www.gogojungle.co.jp/finance/navi/articles/89870
【Mastering RCI!!】 PDF collection for 1-minute short-term trading (scalping)
https://www.gogojungle.co.jp/finance/navi/articles/88762
【Mastering RCI!!】 PDF collection for 15-minute trading
https://www.gogojungle.co.jp/finance/navi/articles/113513
【Mastering RCI!!】 Summary of PDFs explaining profit-taking points
https://www.gogojungle.co.jp/finance/navi/articles/89471
PDF collection for effectively utilizing R1R2S2【Mastering RCI!!】
https://www.gogojungle.co.jp/finance/navi/articles/93154
【Mastering RCI!!】 PDF collection for effectively utilizing MT5 version mBDSR
https://www.gogojungle.co.jp/finance/navi/articles/84918
mBDSR (RCI Filter)andmBDSR (Moving Average Filter)have different roles. The accompanying PDFs also touch on how to use them distinctly.
Below weintroduce examples of signals for the mBDSR (Moving Average Filter).
Nikkei Stock Average JP225 4-hour chart
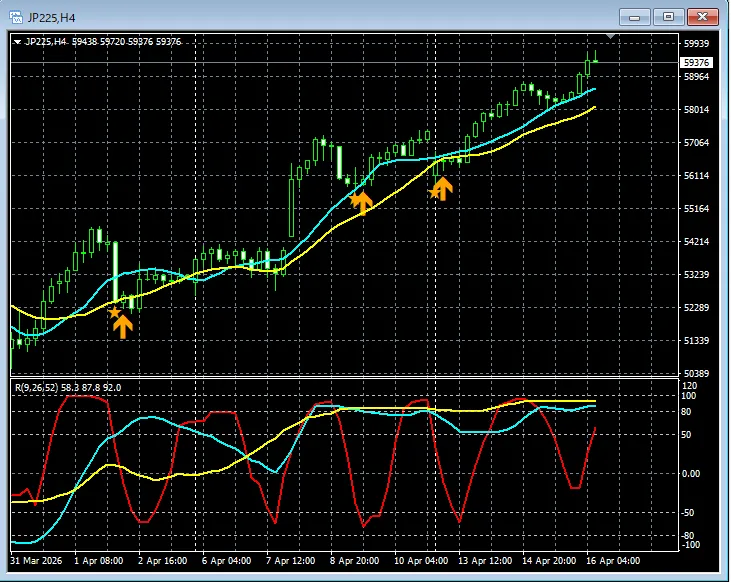
In the chart above,the signal of the moving average filter mBDSRlights up at the right timing.
In the case of the Moving Average Filter mBDSRalsoUsing it in conjunction with top-down analysis using the three RCI linesenables high-probability trades. This is also explained in the attached PDFs.
※ Please note that in the charts shown in this article, for convenience of explanation, elements such as circles, lines, and rectangles may be drawn.
Indicator that shines when combined with RCI: 【BODSOR・mBDSR】
and its methods, case studies (PDF) ★GogoJungle AWARD2020 Winner★
https://www.gogojungle.co.jp/tools/indicators/11836
Includes more than 550 PDF files (methods and case studies: over 2,000 pages, over 700,000 characters).
Most of these are examples that fully integrate the upper and lower timeframes by logically linking them with the three RCI lines, and then systematically consider multiple lower-timeframe conditions, ultimately waiting for dip buying or pullback selling signals on the lower timeframes (i.e., mBDSR signals).
Also,many materials emphasize identifying points where multiple entry criteria coincide..
Additionally,it also includes methods to explore upside and downside targets using the three RCI lines..
In the PDF explanations,over 1,950 charts are used..

Blacksun Indicators (List)
https://www.gogojungle.co.jp/finance/navi/articles/33779
Free Blacksun indicators and free e-books
https://www.gogojungle.co.jp/finance/navi/articles/90181
【Reference videos related to RCI and mBDSR】
Environment recognition with RCI and multi-timeframe analysis to wait for signals (1)
https://www.youtube.com/watch?v=1prvET_M5mA
Environment recognition with RCI and multi-timeframe analysis to wait for signals (2)
https://www.youtube.com/watch?v=vR4oD-oMVQQ
Environment recognition with RCI and multi-timeframe analysis to wait for signals (3)
https://www.youtube.com/watch?v=C6DHn0lD-I4
Environment recognition with RCI and multi-timeframe analysis to wait for signals (4)
https://www.youtube.com/watch?v=QG1iNTnLyyQ
Environment recognition with RCI and multi-timeframe analysis to wait for signals (5)
https://www.youtube.com/watch?v=VYlGiy6Cllg
× ![]()


