

Euro-AUD 15-minute chart [Master RCI to Win Definitely!!] mBDSR signal
0
【Master RCI!! Trend Reversal, Buy on Dips, Sell on Rises】
Indicator that shines when used in combination with RCI: 【BODSOR・mBDSR】
and methods, case studies (PDF) ★GogoJungle AWARD2020 winner★
https://www.gogojungle.co.jp/tools/indicators/11836
※This product【BODSOR・mBDSR】includes over 550 PDFs (over 2,000 pages in total, over 1,950 chart pages, over 700,000 characters) as methods and case studies.
About the PDFs included with the above product
About the 358 PDF files included with【BODSOR・mBDSR】
https://www.gogojungle.co.jp/finance/navi/articles/34271
【Master RCI!!】 Summary of PDFs with explanations on mBDSR (Moving Average Filter)
https://www.gogojungle.co.jp/finance/navi/articles/90127
【Master RCI!!】 PDF collection for trading using 5-minute chart signals (Day trading)
https://www.gogojungle.co.jp/finance/navi/articles/89870
【Master RCI!!】 PDF collection for 1-minute short-term trading (Scalping)
https://www.gogojungle.co.jp/finance/navi/articles/88762
【Master RCI!!】 PDF collection for 15-minute trading
https://www.gogojungle.co.jp/finance/navi/articles/113513
【Master RCI!!】 Summary of PDFs explaining profit-taking points
https://www.gogojungle.co.jp/finance/navi/articles/89471
PDF collection for effectively using R1R2S2【Master RCI!!】
https://www.gogojungle.co.jp/finance/navi/articles/93154
【Master RCI!!】 PDF collection for effectively utilizing MT5 version of mBDSR
https://www.gogojungle.co.jp/finance/navi/articles/84918
Belowintroduces examples of signals for mBDSR (RCI two-filter)with the two-filter signals.
Euro-Ozzy EURAUD 15-minute chart
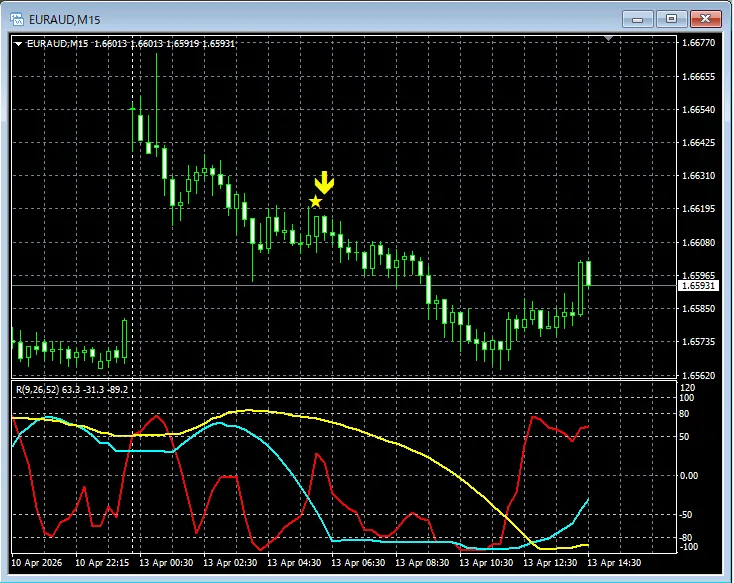
In the chart above,signs from mBDSR (RCI two-filter)light up at the right timing.
In the case of the Moving Average Filter mBDSRas well,by combining with the top-down approach using three RCI linesto drill down from higher to lower timeframes, you can achieve higher-probability trades. Explanations for this are also in the attached PDFs.
※ Please note that in the charts referenced in this article, for convenience of explanation, circles, straight lines, and rectangles may be drawn.
Indicator that shines when used with RCI: 【BODSOR・mBDSR】
and methods, case studies (PDF) ★GogoJungle AWARD2020 winner★
https://www.gogojungle.co.jp/tools/indicators/11836
Includes over 550 PDF files (Methods and Case Studies: over 2,000 pages, over 700,000 characters).
Many of them illustrate a logical linkage of higher and lower timeframes using three RCI lines, exploring multiple lower-timeframe conditions sequentially, ultimately waiting for dips or pullbacks signals on the lower timeframes (i.e., mBDSR signals).
Also,many of them emphasize capturing points where multiple entry bases overlap.There are also many that explore using three RCI lines to identify upside or downside targets.
Additionally,methods that search for uplift or decline targets using three RCI lines are included.Also included.
In the PDF descriptions,over 1,950 charts are used..

Blacksun Indicators (List)
https://www.gogojungle.co.jp/finance/navi/articles/33779
Free Blacksun indicators and free e-books
https://www.gogojungle.co.jp/finance/navi/articles/90181
【Reference Videos (RCI and mBDSR related)】
Relying on RCI for environmental awareness and multi-timeframe analysis to wait for signals (Part 1)
https://www.youtube.com/watch?v=1prvET_M5mA
Relying on RCI for environmental awareness and multi-timeframe analysis to wait for signals (Part 2)
https://www.youtube.com/watch?v=vR4oD-oMVQQ
Relying on RCI for environmental awareness and multi-timeframe analysis to wait for signals (Part 3)
https://www.youtube.com/watch?v=C6DHn0lD-I4
Relying on RCI for environmental awareness and multi-timeframe analysis to wait for signals (Part 4)
https://www.youtube.com/watch?v=QG1iNTnLyyQ
Relying on RCI for environmental awareness and multi-timeframe analysis to wait for signals (Part 5)
https://www.youtube.com/watch?v=VYlGiy6Cllg
× ![]()


