

[Master RCI and win with moving average filter!!] AUD/JPY 5-minute chart mBDSR signal
0
【Mastering RCI!! Trend Reversal, Buy on Dips, Sell on Rallies】
Indicator that shines in combination with RCI: 【BODSOR・mBDSR】
Methods & Case Studies (PDF) ★GogoJungle AWARD2020 Winner★
https://www.gogojungle.co.jp/tools/indicators/11836
※This product【BODSOR・mBDSR】includes more than 550 PDFs (over 2,000 pages, more than 1,950 chart images, over 700,000 characters) as methods & case studies.
About the PDFs included with the above product
About the 358 PDF files included with 【BODSOR・mBDSR】
https://www.gogojungle.co.jp/finance/navi/articles/34271
【Mastering RCI!!】Summary of PDFs that explain mBDSR (Moving Average Filter)
https://www.gogojungle.co.jp/finance/navi/articles/90127
【Mastering RCI!!】 PDF Collection for Trading (Day Trading) Using 5-minute Signals
https://www.gogojungle.co.jp/finance/navi/articles/89870
【Mastering RCI!!】 PDF Collection for 1-minute Short-Term Trading (Scalping)
https://www.gogojungle.co.jp/finance/navi/articles/88762
【Mastering RCI!!】 PDF Collection for 15-minute Trading
https://www.gogojungle.co.jp/finance/navi/articles/113513
【Mastering RCI!!】 Summary of PDFs Explaining Profit-Taking Points
https://www.gogojungle.co.jp/finance/navi/articles/89471
PDF Collection for Effectively Utilizing R1R2S2【Mastering RCI!!】
https://www.gogojungle.co.jp/finance/navi/articles/93154
【Mastering RCI!!】 PDF Collection for effectively using MT5 version of mBDSR
https://www.gogojungle.co.jp/finance/navi/articles/84918
mBDSR (RCI Filter)andmBDSR (Moving Average Filter)serve different roles. The usage distinctions are also touched upon in the accompanying PDFs.
Below, we introduce examples of signals frommBDSR (Moving Average Filter)signals.
Australian Dollar / Japanese Yen AUDJPY 5-minute chart
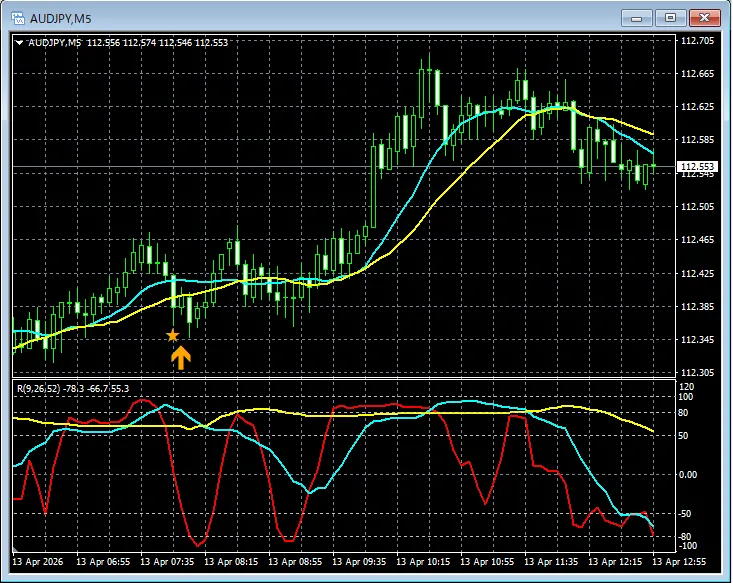
On the above chart,signals from the moving average filter mBDSRlight up at well-timed moments.
With the Moving Average Filter mBDSRas well,when combined with the higher-timeframe to lower-timeframe consolidation using the 3-line RCI, enables high-probability trades. The accompanying PDFs explain this as well.
※ Please note that charts shown in this article may have circles, lines, and rectangles drawn for ease of explanation.
Indicator that shines in combination with RCI: 【BODSOR・mBDSR】
Methods & Case Studies (PDF) ★GogoJungle AWARD2020 Winner★
https://www.gogojungle.co.jp/tools/indicators/11836
Includes more than 550 PDF files (methods & case studies: over 2,000 pages, over 700,000 characters).
Most of them are examples that break down the process of linking higher and lower timeframes logically using the RCI 3-line, sequentially studying the状况 of multiple lower timeframes, and ultimately waiting for dips in the lower timeframes or rallies (the mBDSR signals).Additionally,
There are also materials that explore timing for upward or downward targets using the RCI 3-line.
In the PDF explanations,
over 1,950 chartsare used.

Blacksun Indicators (List)
https://www.gogojungle.co.jp/finance/navi/articles/33779
Free Blacksun indicators and free e-books
https://www.gogojungle.co.jp/finance/navi/articles/90181
【Reference Videos (RCI and mBDSR related)】
Environment recognition using RCI and multi-timeframe analysis to reach the point of waiting for a signal (1)
https://www.youtube.com/watch?v=1prvET_M5mA
Environment recognition using RCI and multi-timeframe analysis to reach the point of waiting for a signal (2)
https://www.youtube.com/watch?v=vR4oD-oMVQQ
Environment recognition using RCI and multi-timeframe analysis to reach the point of waiting for a signal (3)
https://www.youtube.com/watch?v=C6DHn0lD-I4
Environment recognition using RCI and multi-timeframe analysis to reach the point of waiting for a signal (4)
https://www.youtube.com/watch?v=QG1iNTnLyyQ
Environment recognition using RCI and multi-timeframe analysis to reach the point of waiting for a signal (5)
https://www.youtube.com/watch?v=VYlGiy6Cllg
× ![]()


