

[Master RCI to win with moving average filter!!] Yesterday's AUDJPY 5-minute chart mBDSR signal
0
【 master RCI!! Trend reversal, pullback buying, and pullback selling】
Indicator that excels when combined with RCI【BODSOR・mBDSR】
and method · case studies (PDF) ★GogoJungle AWARD2020 winner★
https://www.gogojungle.co.jp/tools/indicators/11836
※This product【BODSOR・mBDSR】includes over 550 PDFs (over 2,000 pages in total, over 1,950 chart images, over 700,000 words) as methods and case studies.
About the PDFs included with the above product
About the 358 PDFs included with 【BODSOR・mBDSR】
https://www.gogojungle.co.jp/finance/navi/articles/34271
Summary of PDFs explaining the mBDSR (moving average filter) within the series “Master RCI!!”
https://www.gogojungle.co.jp/finance/navi/articles/90127
【Master RCI!!】 PDF collection for trading using 5-minute chart signals (day trading)
https://www.gogojungle.co.jp/finance/navi/articles/89870
【Master RCI!!】 PDF collection for 1-minute short-term trading (scalping)
https://www.gogojungle.co.jp/finance/navi/articles/88762
【Master RCI!!】 PDF collection for 15-minute trading
https://www.gogojungle.co.jp/finance/navi/articles/113513
【Master RCI!!】 PDF collection explaining profit-taking points
https://www.gogojungle.co.jp/finance/navi/articles/89471
PDF collection to effectively use R1R2S2【Master RCI!!】
https://www.gogojungle.co.jp/finance/navi/articles/93154
【Master RCI!!】 PDF collection for effectively using MT5 version mBDSR
https://www.gogojungle.co.jp/finance/navi/articles/84918
mBDSR (RCI filter)andmBDSR (moving average filter)have different roles. The distinctions are also touched on in the included PDFs.
Below, we introduce example signals formBDSR (moving average filter)signals.
AUDJPY 5-minute chart
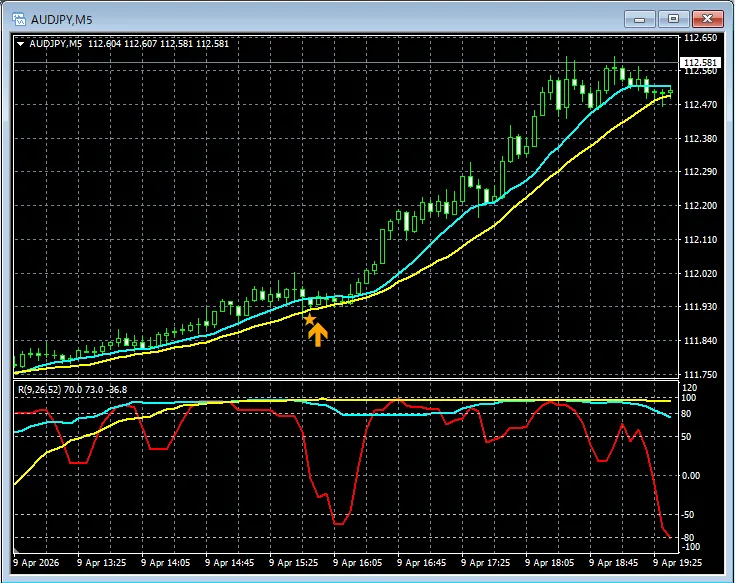
In the chart above,the mBDSR signalslight up at well-timed moments.
In the case of the Moving Average Filter mBDSRas well,using it in conjunction with the top-down approach using the three RCI linescan enable high-probability trades. The details are explained in the included PDFs.
※ Please note that in charts mentioned in this article, for convenience of explanation, circles, straight lines, and rectangles may be drawn.
Indicator that shines when combined with RCI【BODSOR・mBDSR】
and method · case studies (PDF) ★GogoJungle AWARD2020 winner★
https://www.gogojungle.co.jp/tools/indicators/11836
Includes over 550 PDF files (methods and case studies: over 2,000 pages, over 700,000 words).
Many of them are designed around logically linking higher and lower timeframes using the three RCI lines, examining multiple lower-timeframe conditions sequentially, and ultimately waiting for pullbacks or pullback buys on the lower timeframes (i.e., signals from mBDSR).
Also,there are many ones that emphasize capturing points where multiple entry reasons overlap.There are also methods that explore price targets for rises and falls using the RCI three-line approach.
In the PDF explanations,
over 1,950 charts are used.

Blacksun Indicators (List)
https://www.gogojungle.co.jp/finance/navi/articles/33779
About Blacksun free indicators and free e-books
https://www.gogojungle.co.jp/finance/navi/articles/90181
【Reference videos (RCI and mBDSR related)】
Getting signs by environment recognition and multi-timeframe analysis using RCI (1)
https://www.youtube.com/watch?v=1prvET_M5mA
Getting signs by environment recognition and multi-timeframe analysis using RCI (2)
https://www.youtube.com/watch?v=vR4oD-oMVQQ
Getting signs by environment recognition and multi-timeframe analysis using RCI (3)
https://www.youtube.com/watch?v=C6DHn0lD-I4
Getting signs by environment recognition and multi-timeframe analysis using RCI (4)
https://www.youtube.com/watch?v=QG1iNTnLyyQ
Getting signs by environment recognition and multi-timeframe analysis using RCI (5)
https://www.youtube.com/watch?v=VYlGiy6Cllg
× ![]()


