

GBP/JPY 15-minute chart [Master RCI to win!!] mBDSR pullback buy signal
【Mastering RCI!! Trend Reversal, Buy the Dip, Sell the Pullback】
Indicator that shines in combination with RCI【BODSOR・mBDSR】
Method・Case Studies (PDF) ★GogoJungle AWARD2020 Winner★
https://www.gogojungle.co.jp/tools/indicators/11836
※This product【BODSOR・mBDSR】includes over 550 PDFs (over 2,000 pages in total, more than 1,950 chart images, over 700,000 words) as methods and case studies.
About the PDFs Included in the Above Product
358 PDF files Included with 【BODSOR・mBDSR】
https://www.gogojungle.co.jp/finance/navi/articles/34271
【Mastering RCI!!】Summary of PDFs explaining mBDSR (Moving Average Filter)
https://www.gogojungle.co.jp/finance/navi/articles/90127
【Mastering RCI!!】Additional PDFs for trading using 5-min chart signals (Day Trading)
https://www.gogojungle.co.jp/finance/navi/articles/89870
【Mastering RCI!!】PDF collection for 1-min chart short-term trading (Scalping)
https://www.gogojungle.co.jp/finance/navi/articles/88762
【Mastering RCI!!】PDF collection for 15-min chart trading
https://www.gogojungle.co.jp/finance/navi/articles/113513
【Mastering RCI!!】Summary of PDFs explaining profit-taking points
https://www.gogojungle.co.jp/finance/navi/articles/89471
PDF collection to effectively utilize R1R2S2【Mastering RCI!!】
https://www.gogojungle.co.jp/finance/navi/articles/93154
【Mastering RCI!!】PDF collection to effectively utilize MT5 version of mBDSR
https://www.gogojungle.co.jp/finance/navi/articles/84918
Below,mBDSR (Two RCI filters)-sign examples will be introduced.
GBPJPY 15-minute chart
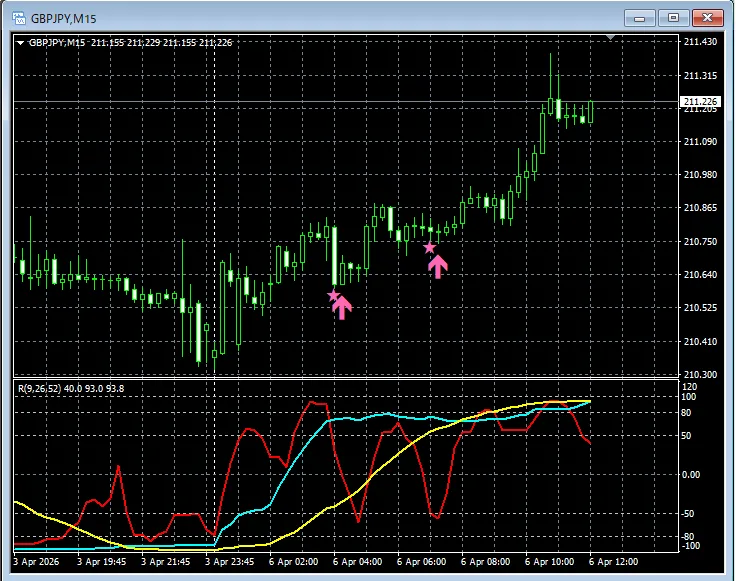
In the chart above,signs from mBDSR (Two RCI filters)are lighting up at timely moments.
When using Moving Average Filter with mBDSRit is alsoadvantageous to combine with the top-to-bottom breakdown using the three RCI linesfrom higher to lower timeframes. This area is also explained in the included PDF.
※Note that for readability, charts in this article may include added circles, lines, or rectangles.
Indicator that shines in combination with RCI【BODSOR・mBDSR】
Method・Case Studies (PDF) ★GogoJungle AWARD2020 Winner★
https://www.gogojungle.co.jp/tools/indicators/11836
Includes over 550 PDF files (methods and case studies: over 2,000 pages, over 700,000 words).
Many of them describe the process of logically linking higher and lower timeframes using three RCI lines, gradually analyzing multiple lower timeframes, and ultimately waiting for pullback buys or pullback sells on the lower timeframes (i.e., a sign from mBDSR).
Additionally,many PDFs emphasize identifying points where multiple entry reasons align.They also include methods for exploring upside and downside targets using the three RCI lines.
In the PDF explanations,
over 1,950 charts are used..

Blacksun Indicators (List)
https://www.gogojungle.co.jp/finance/navi/articles/33779
Free Blacksun indicators and free e-books
https://www.gogojungle.co.jp/finance/navi/articles/90181
【Reference Videos (RCI and mBDSR related)】
Shape for waiting for signals using environment recognition and multi-time-frame analysis with RCI (Part 1)
https://www.youtube.com/watch?v=1prvET_M5mA
Shape for waiting for signals using environment recognition and multi-time-frame analysis with RCI (Part 2)
https://www.youtube.com/watch?v=vR4oD-oMVQQ
Shape for waiting for signals using environment recognition and multi-time-frame analysis with RCI (Part 3)
https://www.youtube.com/watch?v=C6DHn0lD-I4
Shape for waiting for signals using environment recognition and multi-time-frame analysis with RCI (Part 4)
https://www.youtube.com/watch?v=QG1iNTnLyyQ
Shape for waiting for signals using environment recognition and multi-time-frame analysis with RCI (Part 5)
https://www.youtube.com/watch?v=VYlGiy6Cllg
× ![]()


